NCache Health and Performance Monitoring
Recorded webinar
By Ron Hussain
This video webinar is a comprehensive introduction to the options and tools available for optimum health of your applications running through NCache.
You'll learn about health alert and performance options for both the NCache Server and NCache Client (application side), specifically:
- NCache health alert features: overview and how to use them
- NCache performance monitoring: overview and capabilities
- The built-in tools for health and performance monitoring
- NCache monitoring through Operating System (Windows) resources
- NCache monitoring through 3rd party tools
- How to debug NCache health and performance issues
The topic that we've selected today is NCache health and performance monitoring. So, basically, I'll be covering different monitoring options within NCache in this particular webinar and I'll tackle it in two different ways. I'll talk about health-related options that you can utilize and then performance monitoring and that's application performance as well as NCache server-side performance. This is an NCache based topic so I would assume that you already know some details about NCache and I'll share some basic details as well but agenda of today's webinar is that we have a specific topic in hand. It is about NCache and I'll expose NCache features in regards to health and performance monitoring.
NCache Deployment
Alright! So, first a starting point is NCache deployment. Like I said, I would assume that NCache is already set up, but if it's not, this is a typical deployment for NCache.
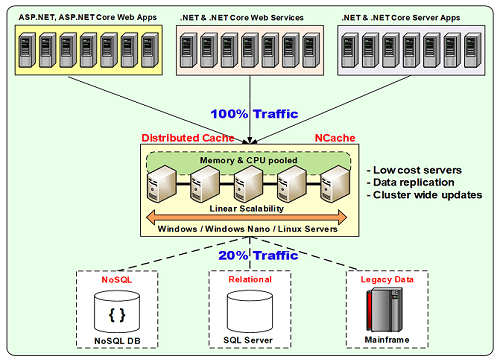
We have a server tier where we have multiple servers residing and then we have application tier which is actually connecting to this in a client-server model. So, you could use a separate caching tier where servers are dedicated for caching and then your applications can run on their own respective tier. These could be ASP.NET web applications, web forms or MVC, ASP.NET web services or Java Web Services, WCF or any other or it could be any back-end server applications which are all connecting to NCache. So, whenever you have such a deployment in hand, where you have a caching from NCache and then your applications are connecting to NCache, there could be multiple questions in regards to what is cached? What is the throughput? What is the performance matrices? What is the performance gain with different object sizes or if there are any issues. How to debug that?
So, that's all what I'm going to cover today. I'm going to talk about different logs, different health-related events that you can capture and cache monitoring features in regards to health. I'll talk about different debug logs that you can set up and on top of it I'll give you a performance comparison as well so all of this is bundled into this webinar. A lot is going to come and everything is hands-on.
NCache Server Requirements
Without further delays, let's actually get started and this is NCache server requirements. We typically cover this in our regular demos and webinars. So, it's 8 cores or more, that's a minimum recommended setup for NCache but you could have more cores as well. RAM is as per your use case, 16gb or more. It's supported in all windows environments as well as NCache server portion is concerned, it is recommended that you use 2012 or 2016 but it can work on older versions as well such as 2008 operating system, .NET 4.0 or later, 4.6.1 or 4.6.2 or 4.5. That's most commonly used. And, remote clients can be on any framework again in any windows environment. 32-bit and 64-bit all environments are supported as well.
Setup Environment
So, having said that, I'll quickly jump and get started with this. I'll quickly create a demo environment and for that I'll be using two nodes and a few clients to connect to it. And, again I would use an assumption that I would not share a lot of details on how to create a cache, what are the configurations, what are the topologies. I would assume that you already know that detail. If you don't, in that case please find our architectural webinars or architectural demos that we do every month as part of NCache or as part of technology webinars that we do.
So, I'll be using ASP.NET web application as well as a console application which comes install with NCache so that's what I have in mind. So, basically this is what I'll quickly do to get started with this. I'll log onto my dev environment. There's a cache that I've already configured so I'll just create a new project and then you create the caches. So, I'll just create a demo cache and this is the cache that I'll be using for all the performance and health related monitoring aspects of NCache. I'll choose partition replica cache, that's our most popular one, so I would recommend that you also choose this and then async that is the mode of replication between servers and again demo1 and demo2.
All of these steps are documented in great details in our existing webinars and demos that you can look up at our website. So, this is how you specify the server's TCP port for communication and then the size of the cache cluster. I have something in mind in terms of getting notified when cache becomes full and how to react to that so.. And I will just turn off evictions for now or just keep it turned on. Actually, let's turn it off because I would actually showcase how a cache becomes full and what is needed in that scenario. Evictions is a way when cache becomes full, it automatically makes room for the new items by removing some items from the cache. So, let's not do that, choose finish and that has created our Cache.
I'll quickly add my box as a client, which is my personal computer right here. I need to check if NCache service has started or not. I've been fiddling around with environments so please bear with me. It may.. yeah it started so I think it's added as well so, All right! So, let's actually get started. So, our environment is set up. Ignore the test cache for now because I was playing around with it. Just focus on the demo cache. I've clicked on it. You can see on the right pane. These are all the settings for this particular cache. It’s not started as yet. So, I'll quickly start this so that both servers are started. When you just use the start button from here or from here, it actually starts cache on all the caching servers. And, then next I'll actually start with some basic Steps; how to know your cache has started? how to know it's healthy and how to know if it's showing activity? So, these are some basic steps that we will take right now and then we'll build on top of it. We will progress into it by taking it to some extensive levels, some advanced levels.
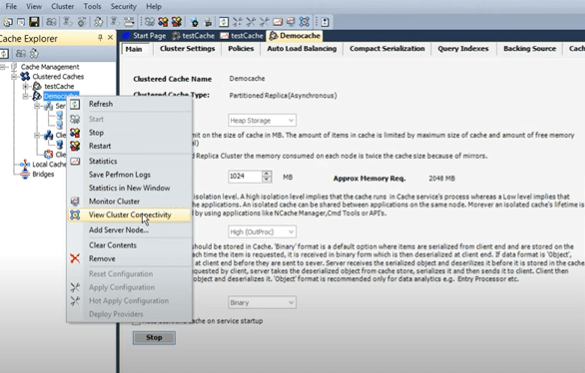
So, cache has been started so first step that you could use from the manager or from the command line and by the way all of this can be done through command line as well so it's not just the GUI tools. There are command-line tools which are equally equipped in comparison to GUI. I will right click and in order to check the health of the cache cluster, I would open a view cluster connectivity box.
That actually gives me an idea about fully connected status. Each server has an active and a backup. Let me show you a diagram for that real quick. Because I've chosen a topology so we have this partition replica cache and an architecture is that you have an active partition where there exists and then there is a passive partition where replicas of another service maintained.
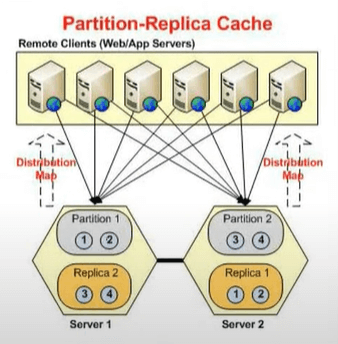
So, server one’s active back open to server two and server two’s active backup on one. These are actives, these are passives. These only become active and this goes down, right? So, if this goes down you would have this becoming active and if this goes down you have the backup becoming active. So, each server has two partitions. We have two servers we would have four partitions and this is exactly what you're seeing here.
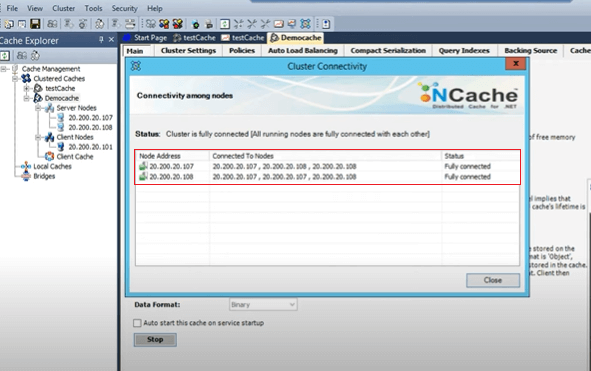
So, one is connected to its own backup, other servers active and the other service backup. And, server two is connected to its own 107 which is the other server, other server’s backup and its own backup. You know it's in an increasing pattern and it's fully connected as well. If you see, now let me just share some details. The status message can be not connected or partially connected or cache service is not started. So, all of these mean that there is some issue with the cache cluster so until or unless you see the fully connected status, your cache has not started properly. So, that's the first building point, when you create a cache started make sure you check the fully connected cache status.
And, this output can be used through list caches as well. That's a tool which comes, let me just bring it here, this caches. And, if you run the list caches, with /a if you just run it, it will just give you the local information that demo cache has started. But, if you just do it with this cache, for example, A switch, it actually gives you that cluster sizes for 107 ports, 107:7802 for the backup. 108:7807 and 708 and count.
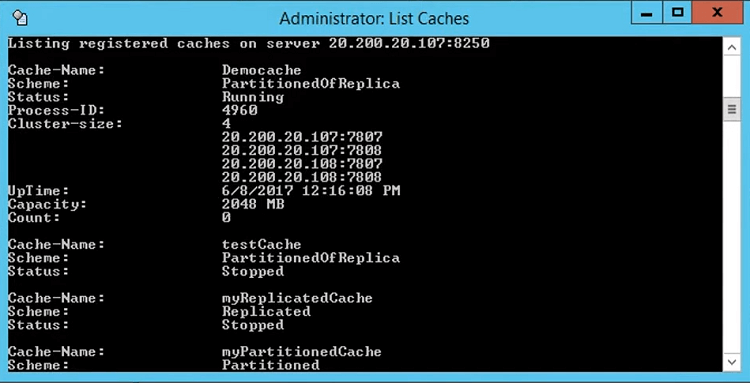
So, this gives a healthy indication of this. So, you have to look up this information if you use list caches otherwise view cluster connectivity gives you this in a GUI manner.
Each cache has a cache host process so you have the cache flows process for demo cache as well as for Demo cache two. And, you could actually see if you add a detailed for example, inside the description of this you could actually see the associated cache as well. I think is in the command line but if you add a command line column here, you could actually see the cache name. But, we usually rely on the process IDs because that's what matters to us and I'll explain more on this in coming slides. So, having said that, our cache seems to be up and running so that's our first building point.
Next is how to check the activity on the cache, basic activity if cache is taking requests or not. So, for that you could just right click and choose statistics. This would open perf-mon counters and these are server-side counters which you see in the NCache manager but you could also see the client-side counters as well, which I'll cover in great details. I have a scenario that I'll show you with different varying object sizes I'll show you the client-side averages and how those get impacted. So, that's something that I have lined up towards the end of this webinar. So, that's coming up as well. But, just to show you the basic side of things, let me just bring it right here, you have demo cache and the replica demo cache and the replica. No activity is being generated at this point because we're not running any tests so we'll have to do that and for that I can just run, since I've added my box as a client, I'll run the command line tool to get started with this.
It can take different parameters as well but for now I'll just use some basic values for it and you could see the requests per second already coming In. So, we have server one taking requests, backup is not taking requests but count is being updated but server two is taking requests so you could see it right here and then we have the backup of server two which is actually backup. So, one backup partition is being lined up. So, this actually gives us another confirmation that cache is running fine.
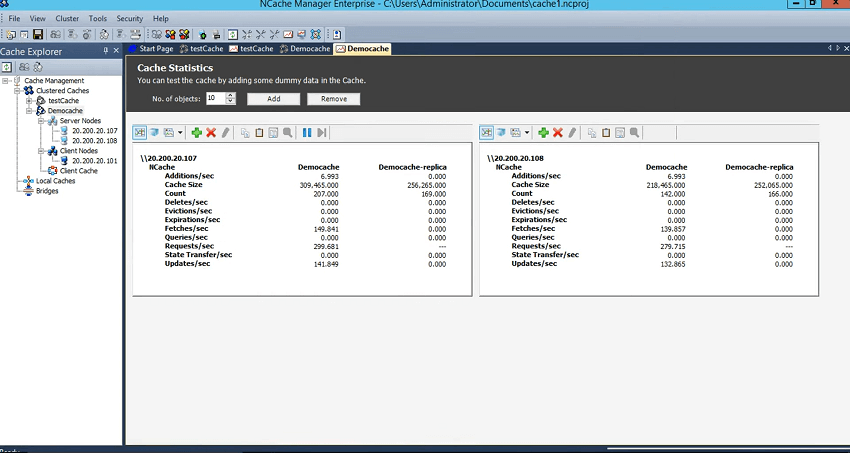
Requests are evenly distributed. You could see this request per second counter right here. And, we have the backups being updated as well.
So, our first step, basic monitoring as far as health is concerned is something which our walls around this and then we can advance from this point onwards, we could see if what are the issues going on with the Cache. We could get notified and I'll talk more details around that.
Monitoring Options
I'll quickly get ahead and get started with the monitoring options within NCache. So, this is what I've lined up. Yesterday, I spend a lot of time on explaining these and then I got a feedback that we should focus more on the hands-on portion, hands on side of the things. So, this is what I will do today. Like I said, I will use a different spin on this webinar today.
Monitoring using PerfMon Counter
So, we have PerfMon counters. We have server side and client side, I'll show you those. We have event log entries and using these event log entries we have this monitoring tool which gives you alerts. We have this email alerts which gives you email related alerts. And, then you could also use a third-party tool to hook onto these event Logs. So, these are pretty extensive and I would say most important factor when it comes to the monitoring aspect of NCache.
Monitoring using Logs
And, then we have the logs. There are multiple ways you could configure the logs. We have server-side logs, client-side logs, there is a separate tool called log analyzer. Then there's a data analyzer tool with the help of link pad integration and then we have the API logs as well which can actually demonstrate how much time individual calls are taking and it's just a plug-and-play option. And, like I said, we have third-party integrations you could use SCOM to hook on to these logs, to hook on to these event log entries and then we have AppDynamics or any other third-party tool and then you could use NCache for that.
NCache Monitoring Tools – Demo
Today, I'm just going to use the actual demo of the different avenues so let's get started with NCache monitoring tools which comes installed with NCache. Now that you have a request set up, let me go to another client and let's actually use a server box. Server can also use a client so you could actually see that. Let's run a stress test tool from here and then let's run a stress test tool from here as well so that we have significant, I would call it a significant load as far as requests per seconds are concerned. And, you could see about fifteen hundred requests per second and now two thousand plus requests, between two and three thousand requests per second on server one and server two.
Now, the basic monitoring requirements for real time as well as for logging that can be covered through our monitoring tool. You don't have to look anywhere else, you don't have to review the logs, you don't have to go into your event logs or hook on to any third-party tools. There is a tool which comes installed with NCache so I would recommend that you use it as is and I'll give you a quick demo of that particular tool.
Pre-Configured Monitoring Dashboards
I will right click and choose monitor cluster and this would open the NCache monitoring tool which comes install with NCache. Now nice thing about this is that it monitors your servers as well as the clients and it doesn't have to be one of the servers or the clients it could be a third box into your network. It doesn't have to be any of the cache deployments.
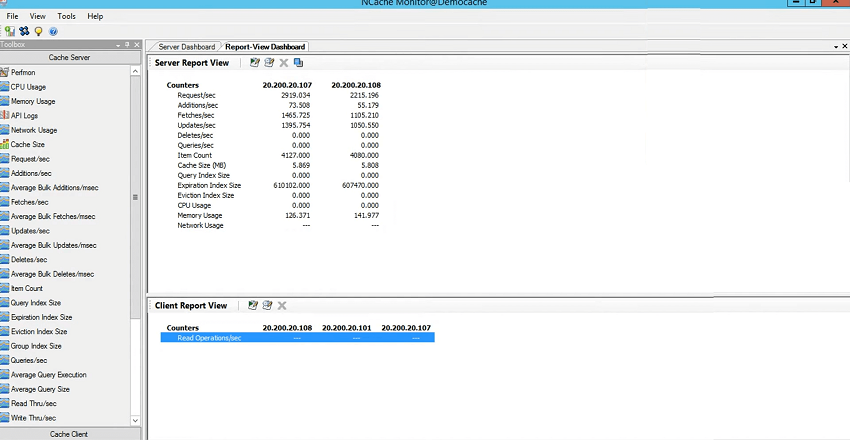
So, we have 107, 108 and 3 clients. My box has some rules so it does not allow remote monitoring but you would be able to see 108 and 107 counters and all you need to do is, go to the view, make sure these server and client dashboards are checked. My box would error out that is expected. But, you could see the same connectivity box showing fully connected status and by the way if there would be any change would change it in real time. That's the beauty of this monitor tool that it exhibits all the statuses in real time.
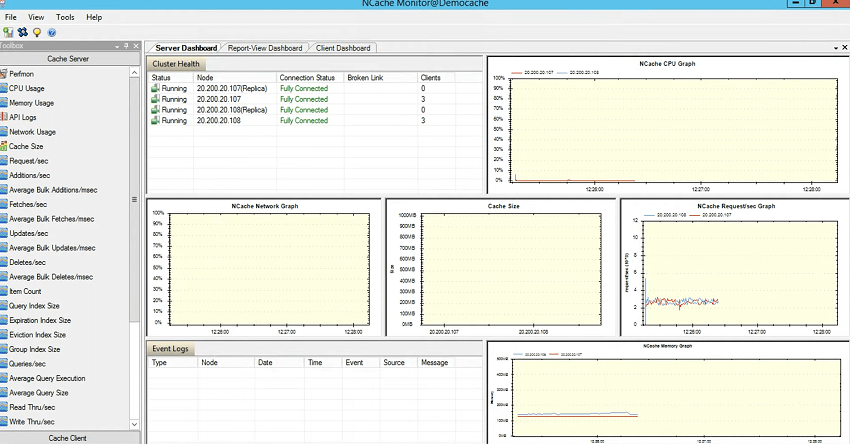
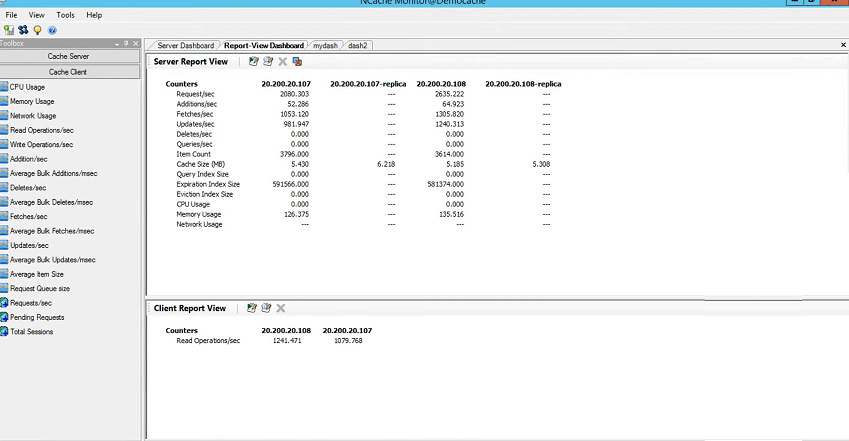
CPU graph, for CPU server 1 and server 2 are listed here. Network graph, if there would be any network activity that would be shown here. Cache size graph and then requests per second graph. So, there isn't any huge activity going on at this point as far as size and network is concerned so you're seeing about almost zero values but as far as requests per second you could see about it's a factor of thousands so about 3,000 requests per second by server one as well as per server two. And, we have the memory going up as well. So, this actually explains that server one and server two are utilizing and that there are three clients which are connected to it and then you could see the client dashboard as well. So, 108 and 107 are clients and you're seeing that they're sending read requests and there is an activity as well.
Custom Monitoring Dashboards
So, this covers the real-time monitoring aspect of some pre-configured dashboards. But, you don't have to rely on these. You could actually take one step ahead and you can create your own dashboards and that's where the fun begins. I'll just say, my dash, let me just do one thing, just to actually have it more robust, let me just show you another way of opening the monitor tool. You would also open the monitor tool from here directly. All you need to do is pick the server and it will be remote server as well and you just specify the name of the cache. So, that's another way you actually specify and now you could see the same and now we have two clients because I've closed one client. Now you would see actually more activity as far as CPU request because we have only two servers and two clients.
Now coming back, you can create your own dashboards in NCache monitoring tool. And, by the way, these are all Perf-mon counters. I am actually going to show you the performance monitor tool as well where you could actually achieve the same using windows performance monitoring as well. So, if you are comfortable with that, use that. If you would just like to use NCache monitor tool which comes installed with NCache, that's another excellent choice. And, by the way, this is a real-time view. Let me just create this dash. So, creating your own dashboard means that you would have an empty panel, let's use 2 by 2 column and this would be utilized for any of the perf-mon counters that you see on the left side of the screen. you have CPU usage on the server side, event logs, cluster health, write operations, item count and so far so good. Everything is listed here and then you have the client-side counters as well.
So, it gives you server-side and client-side personalized monitoring and on top of it this also gives you a perf-mon control that you can actually drag and drop right here. So, you could add any performance counter. It could be windows performance counters, it could be memory, .NET cellular memory, CPU, any sort of performance related counters or health-related counters for NCache can be added here. And, I'll talk about those in some detail. All right! So, I'll just create another dash so that we have two dashboards. Let's call it dash two and let's say 2 by 2 is the size. That's the standard.
Okay! So, while we're at it, I'll quickly show you first dashboard and I'll show you the client processes which are connected to it. So, this gives you an overview of all the client processes which are currently connected to my cache. So, you could come here, use this window, use the client IP, process ID, port they're connected to, server IP they're connected to, and bytes sent and received. So, if you see a heavy activity from one of the client applications, you could actually see the connection here as well. There could be a connection broken. You would always see one process ID connected to all the servers so 4016 is connected to 107, 4016 is also connected to 108. So, if there are any connection issues, for example, your worker process got started there were three servers in the cache and one of the worker processes could not connect to server 3, so how to know about it?
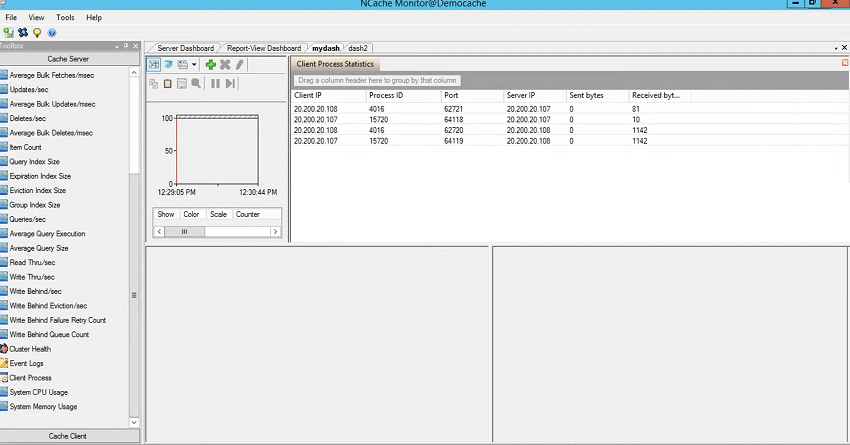
First of all, there are events that are triggered and I'll talk about those shortly, so that's an explicit way of getting notified. But, you see if there is an abnormal behavior, if there is a slowness or if there is an extended amount of requests because, if a server is not connected by the client, client would send requests to other servers and those would reroute that request to that other server and that can take time. So, you can come onto this screen and then pick the IP, you could start it with the process ID and then see if there is a connection which is not listed here.
The other way would be the number of clients. So, one of the servers would be here would be having less number of clients listed in this window in comparison to others. So, that's one important tool I wanted to show and then you could see some personalized fetches per second being done, additions per second being done and then on the dash two you could come to the client side and then you could see the network usage of the client CPU usage of the client that you'd usually not see in the pre-configured dashboards.
So, this is again for the real-time monitoring. What about the historical data? What about logging? So, that is also built into this tool. So, you could actually come here and start logging and this would actually and then you could also schedule some logging as well and you could also choose to show replicas here, if that's a requirement and then there are a few options that you can play around. For example, pick the sample rate, use the graph and then use the event logs that you actually want to see inside the cache. So, this gets you the real-time monitoring as I mentioned. If the requests load is coming in, you would see these. Then you can expand on this particular time the. The time it takes to populate and then the window of these individual dashboards that can be changed as well and like I said there's a log in support to go with it.
So, that covers the basic demo of NCache monitoring tool and I've given you some details on some use cases such as checking the health, checking the client connectivity, the request. Request would be added here as well and you would also see the activity on the server. So, this is your client and this is your server exhibiting the request load and on top of it you have the connectivity client process statistics and connectivity and then you also have client activity as far as network and NCP usage. You would not see network utilize quite heavily because it's not very network intensive at the moment or there could be some permission issues that this dashboard is not being published being published but we'll look into that. But, so far so good everything looks as it should. We're having some activity and we have the clients and servers interacting with one another in a healthy manner. Any questions so far? So, this completes our NCache monitor tool demo which comes installed with NCache.
All right! So, I'll just close the monitoring tool and I'll keep the stress test tool running. I ought to use a web application as well but that's something that I'll do at a later stage.
Event Log and Email Alerts – Demo
Next, I'll show you some health-related alerts and for that I must explain the event log entries that get that become part of your system and then get regularly updated each time you have an event. So, let's go to Windows Event log. NCache.. it actually heavily rights and that's specific to any of the events. For example, we started a cache and each event log for a system is specific to its own server, the view of the cache, the events of NCache service or the cache host for that server so we started cache so first thing is that a separate process gets initiated so that that's what happened here.
Windows Event Viewer Logging
Next event log is that it's replica joint so it started and this replica joint and then you would have Demo cache started successfully on the cache as well. And, then 108 joined to the cache 108 replica joined to the cache and then these are some configuration messages which we can skip and that's about it. These are not related to NCache but as far as these messages are concerned, it should give you a full information about the event log. And, let me just quickly simulate our scenario where we actually use a test cache here and that's why it's here I'll just start one of the caches. Since I'm on 107 so I'll just start 107 and you will see some event logs being propagated in regards to that. So, let's wait once this completes. So, it started. Again, you could use a view cluster connectivity and you could see that only one service not started but what it does not have any status it's not connected because cache is stop, right? So, that you can do and you could also monitor it separately if needed using the monitor cluster.
Now, coming back to the event logs. So, now that we have done that they should be test cache started but before that test cache process got initiated and then we have 107 replica. So, what happens is each time you start a cache the cache process gets initiated so there's an event log entry for that and then there is a replica the actual box starts actually cache starts and its replica joins the cache cluster. And, you have the information added as part of it and there's a data collector set that actually gets initiated but currently my machine.. I've turned those off so that's why we're getting there and test cache started successfully that's the event that you should be interested in and after that your application. Then there are event IDs that you can hook onto and use any other tool or use NCache monitor for that or any of the tools to get notified around that. So, these are event logs.
Now, since these are published to Windows, each time your cache gets started, it gets stopped and I'll show you that I add another node to it. You wouldn't get notified via event logs and if I stop the cache I would get notified via event logs. If your cache becomes full you would get notified. If state transfer starts, network glitches occur, if two service break connectivity, each time you would have these updated events and you would actually take it from there. So, again 107 has joined. Cache started successfully and now 108 has joined to the test cache and 108 replica has joined to the test cache. So, these are events which are again logged and then event ID remains the same but the message is important. So, you get notified. And, I'll quickly stop the cache and you would see the event logs again being populated.
So, most of our third-party monitoring is in regards to these. So, now that we have stopped the cache I'll again do a refresh and you would see some information and these are warnings, right? Because your replica join and then node one or two has left the test cache. So, that's an alarming situation because you stopped it or it could be something which goes down on its own. So, in that case you would get notified.
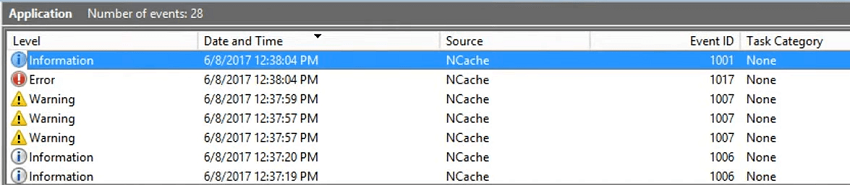
And, then we have another 108 replica going down and then the main 107 replica has gone down. And, then that's another entry you should ignore it and test cache stop successfully. So, in a normal scenario when you stopped it, you would get this safe event as well. Although, there are warnings but if it goes down you would see the verbosity level, the error level wouldn't do change to error. It would not be warning or it would not be information anymore. Our separate process of test cache has been stopped as well.
So, these are the pieces of information that you should look into using windows event locks and if there are any third-party monitoring. For example, we had a customer who was using app dynamics and we helped them turn these events on. So, all they needed to do was turn and cache event logging by using the event ID so you get in touch with us. We'll give you a list of all the events which NCache logs and you take it from there. Use a third-party monitoring tool to monitor and cache as well. So, I'll close this down.
Email Alerts
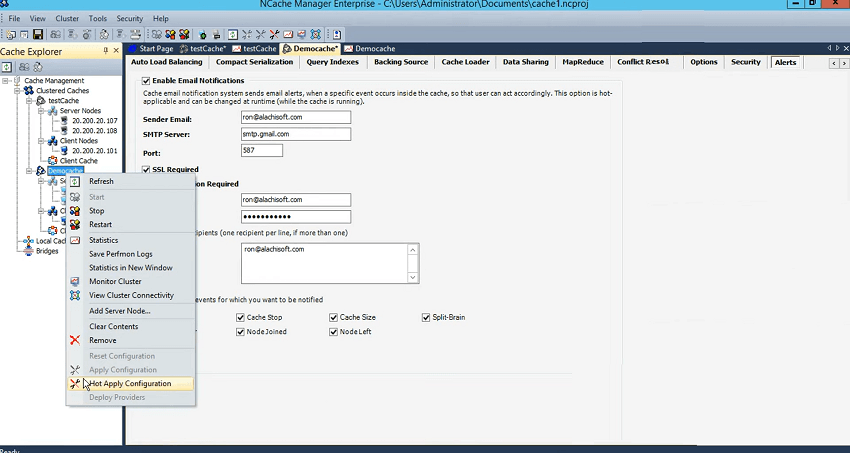
Now, coming back to our NCache features, we exhibit, we actually push information into event logs but we didn't wait over there we actually implemented our own alerting system as well and that was based on these features, it’s called email alerts. Now, all you need to do is enable email alert on a cache And you could do it on a running cache as well. And, I can put my details here, for example, Ron@alachisoft.com. It's something that I have to check from here it's smtp.gmail.com. I am just using my personal… and I'll provide the port as well. let’s keep this information. And, I will just use my login. I will use a recipient.
I'll just send an email to myself and I'll just say cache start or cache stop. Size becomes full. Cluster goes into a split brain, it gets broken. State transfer, which is a process each time a node joins or leaves the other server have to either redistribute it or make the backups active. So, that's the scenario. Node joined nor node left, right? So, you could get notified and all you need to do is to come here and apply configurations.
I would not actually do this for my cache. This cache right here. I've already done that for test cache and all the events set up. I'll just say apply configurations and I'll show you this with the help of an example. So, I'll just start this, right? I've only started 107 and I'll bring back the event logs and if I just refresh it there are a few information so started successfully. 107 has joined. Test cache started successfully. And, you can ignore the error message.
Now what about the email alert? So, for that I'll have to come back to my machine, right here, and I'm expecting an email should be launched. Please ignore this one. So, you would get the same event in the form of email alerts but this time NCache is consuming those events and sending an email alert to the recipients who have subscribed for it. So, you could see that.. First Alert, actually there are many alerts. So, we have 107 joined the test cache then I'll just use this window, right here. Don't have to open it. Started successfully. 108 joined. Actually, these are some old events so let me just use 1133, yeah these are the ones because these alerts were open so I was doing testing based on that.
Okay! So, let's focus on 1133. So, 107 replica has joined and then test Cache started successfully. So, I'll come back here and quickly start 108 and show you that this would actually trigger an email alert and event log entries, side-by-side. Now this is our own implemented SMTP but behind the scenes we're using the event logs, right? So, you can also do that. Again, I'll just refresh here. There are entries, right? So, 106 and 106 again logged twice and if I come back here and do a send receive over here, I should be able to get two more emails or even more because I have State transfer and other events as well. If there's was some data in the cache you would have those events as well. So, there you go. So, 108 test Cache started Test Cache started successfully and this was for 108, right? So, I just do a send receive one more time to make sure that there are no more emails.
So, you can notify your system admins in case of any issues and let's actually simulate an issue. What if node two goes down, right? Or, if there was a connection breakage. We can't really simulate a connection breakage here but we can simulate node going down and I've just done that. So, first of all, it would actually show you the event in event log. There are warnings, right? And, let's see if the email alert picks up teases or not. I hope it's pretty straightforward. I'm just highlighting some of the basic features that you can just use and get the environment monitor as far as health is concerned. So, you could actually see that the node left and then 107, 107 event log has been generated. So, you could put a list of recipients here, as needed or it could be a group but make sure that you specify one recipient per line. All right?
So, the other should be support@alachisoft.com or it could be kal@alachisoft.com. So, so you could actually take it from there. That's how simple it is to get started with the email alerts. NCache monitor tool. We've covered event logs. We've covered NCache email alerts.
NCache Logs - Demo
Next is NCache logs that's something which is slightly an advanced topic but I'll spend as much time as possible on the logs and we can take it from there.
I'll stop this cache because test cache is the one which I've been using and in the meantime while this is stopping let me just open an application. I'm sorry about the folder structure. I copied it from another environment, so.. Alright! So, let me just open my visual studio. I don't need it for this section but I will just keep it open so that I'm prepared while I'm waiting for cache to be stopped and show you the logging capabilities within NCache. Open a website. This is awfully slow for some reason. I wait for it in the meantime let me come back here. I think it's because of the visual studio should not have done that. Anyways, let me see if I can close it down. All right! So, coming back to this, we have the test cache stopped, right?
So, I'll show you the logging capabilities within NCache. So, logs are maintained and these are cache logs. I can just get rid of these, at least these. The caches which are stopped, started you would actually now be able to delete those. So, I'll just start fresh, these are the running caches, don't delete your log files. I just did it for this particular demo. I'll start one node here and show you the log files which are created on the server side and give you some details around it. Understanding the log files would need some advanced information about the clustering and about the framework of NCache. So, I'll just talk about some basics.
Log Analysis using LogViewer Tool
Now that we have created a cache, started the test cache and replica I have initiate it so I'll use this opportunity to actually open the logs to log viewer too. So, if you go to the bin, Tools, GUI there is this log viewer tool which comes installed with NCache. You could use any notepad, WordPad, notepad ++ but this is something that can actually help you sort it with read, time stamp, logger level and then pinpoint the message as well. So, I'll just open. It takes you to the same directory. I'll open the test cache here and you could see all the logs which are there. So, we have… and this is a very interesting tool by the way. You could use different fields and nodes, right? And, then you could provide filter based on that. So, a filter is specified here.
Server Side Logs
So, I'll just show you some basic details. We have operating parameters, 107, 7805. The replicas would always be 7806. Whatever you specify the port the next is for the replica. So, it installs the view, it's the first server. So, 7805 is the only server. So, each time a server starts, it talks to the clustering layer and gets the view. So, it's installs using itself as a coordinator and you see that 7805 107 is using its own view. View ID is 0 and then member joined event. These are again event logs which are related. And, then you see a lot of info messages here and then the replica must have joined here. 7805 and you could see now it has joined 107 with 7806. So, the replica has joined.
So, each server starts up, it tries to find out what other servers are available. If there are no servers available it would start as a first server and then it would start its replica and make a one node cache cluster. And, then you will see a cache, state transfer events and then cache Initialize. It started successfully. So, here, before this event, if you see some error messages like these, don't worry about it because it's trying to connect to other servers and those other servers may not be there as yet because 108 is not started as yet. So, it did try to connect to it but it didn't get any response to it and at this point I'll come here quickly and I'll use the stress test tool, new instance of it. I'll show you the client connectivity event as well. And, by the way all the event logs, all the windows, email alerts that we set up are still intact, right?
So, let me just close it down and come back and like I said you could open it through notepad++ as well. Just open the same tool with notepad. Now, same log file is opened but this time since we started a client as well, towards the end, you would see a client connected box as well. Let me just bring it here. So, there is demo to the IP of the Box, the name of the box, the GUI and a process ID is connected to the cache. So, one server and you would see client connected. Now, a scenario could be that how to know if there is any issue in the cache. So, you would see error messages after this point, that's an indication of their error message. Error message before this is just a discovery. So, those are pretty normal until or unless you see a lot of such error message. You will see a few errors but those are just discovery messages.
Now, I'll just start this cache and I'll show you the logs of this server as well as logs as for the server and show you how that changes. Now, this has been started so all I need to do is come back here, let's see if it refreshes, it didn't, so I'll just come back here and have a look at the log of this server. So, now 108 has been started. So, you would see some more activity. Where was the last entry? Let me just have a look at that. Okay! So, we had this as a loss entry, right? Now, join permission of 108 and it started to join in. 107 installed a view which has 107, 107 and 108. And, now 108 replica would also be joining and then you would have another view which would have 107, 107 replica 108, 108 replica. And, you would see state transfer started and ended so everything went smooth with this. So, new server joined in and all of this is being logged in event logs as well as shown earlier.
Now, I'll just show you the log files of server 2 so that you have some details around that. How the other server… because the other server started and sever one was already there. So, I'll show you the log files usually started with date modified so that you have the latest file on the top. I hope I do. Where is test Cache? There you go! There are other caches running on this box as well. I think the time doesn't show right but let me have a look. Alright! So, anyways, let's use this as an example because I'm short on time. So, it would take time. So, 108 started and, at this time, it actually requested. So, it must have been as a single node , right? But, in this case you would actually see the join permission. So, I would actually not use this. I'm not able to look at the log file for it, All right!
I know what's going on. I'm looking at the local log file folder so there must be the log files from happens, right? So, look at the date modified and this is the actual log file. I apologize for it. Alright! So, now 108 started and you could see that it actually tried but it failed so you would actually see some error messages here. There was this error because it's not the one, it's replica is not there so it's not the first one. So, you see there 107, it's already started so it gave it the view and then state transfers started. These are some buckets information and then member join the cache cluster, All right!
So, that's how simple it is to have a look at the log files but, like I said, these may become complex based on use case, based on the issues that you're seaming and we have the replica log files as well. So, it's good to her actually share errors with us and we could actually help you understand it more. So, each server with the timelines you could see the issues noted down in the log files. I'll quickly come back. I have some more time left so let me actually show you another scenario where.. and let me see if I can open the monitor tool.
API Logs
Now, there is another kind of log file which is inside the monitoring tool so for this particular cache, let's use it. Let's create a new dashboard.
All right! if there's a scenario where your servers are taking more time to complete some requests or there is a slowness, how to tackle that? So, one way is that you look at the performance counters of your application as well as the NCache perf-mon counters which is next section last section to be honest. But, this log file can actually help you pinpoint that we have this API logs. So, if you just open the monitor tool and drag and drop the API logs it uses the Preferences it actually logs information here so I'll just say enable file logging, turn it on and then I think to run it.
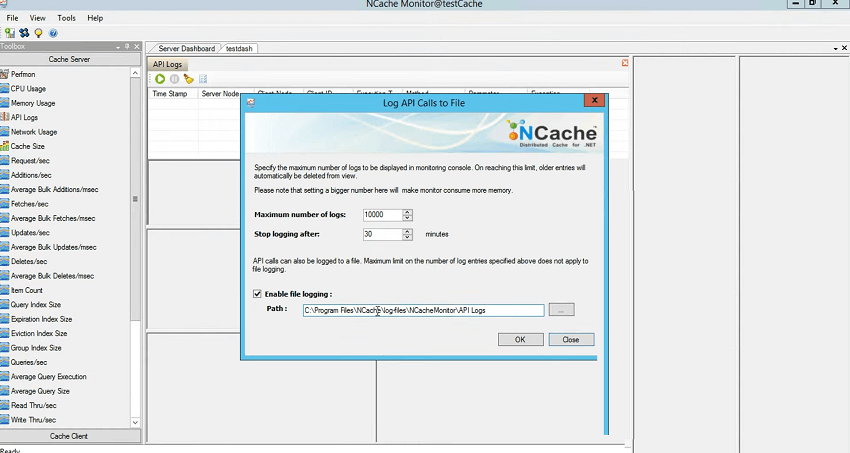
So, you need to simulate the test, say your test takes 15 minutes and you reproduce the issue or in your production environment if there is a specific time when you see slowness or you're not sure what application is causing slowness, what call is causing slowness, what is the method within the application which is causing slowness, you could actually pinpoint that with the help of API logs. So, all you need to do is run this. It would dump all the information and then you stop it once the issue reproduce and then you review it either through this, where you see the timestamp. server node. client from where that request got originated, ID of the client and the execution time. So, this execution time is the most important factor here. At this point it's in sub milliseconds, but, what if we simulate the load and we say stress test tool again using the scenario where test cache for / M 1 024, and this would definitely use a value which is bigger, right? You can see 0.03, right? 0.07 so… Let me close other stresses tools. Yeah! You could see now, time has gone up, right? 0.02, right? And, you could actually see any errors which are being logged on the server side.
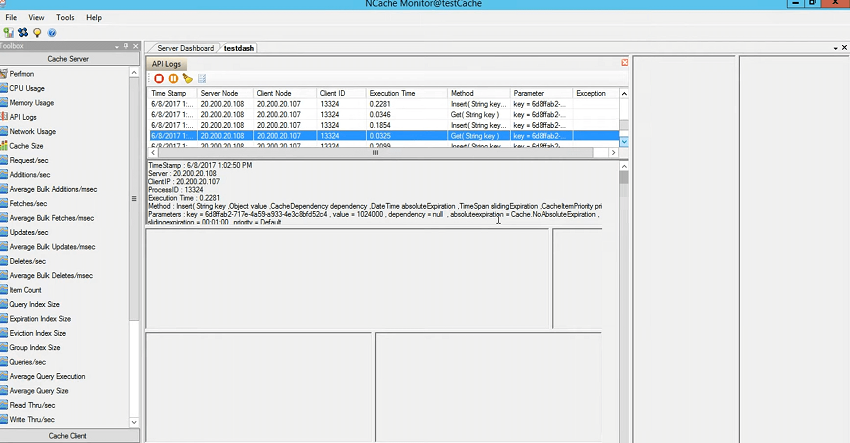
So, any failure, failure is something that's evident that can be logged in the log files but the slowness can be mapped with the help of this feature. And, if I take you back here, in this folder API logs, there is a log file which keeps the historical track of the data. So, first few averages are 0.02, 0.01 and then towards the end you would see some increased values, right? So that gives you an indication against the time that this particular call is slow. I need to verify the method and then you need to correlate with that within your application. So, I think that's something which can be used we use this all the time for debugging our customer environments. Check the time, ask them to reproduce the issue in front of us, enable the logs and then on top of it this can be coupled with client-side logs as well. Inside your client installation, you could specify the logs, for example, If I go to the client portion of NCache on the client machine where the web server is there, there is this enable logs, right?
Client Side Logs
So, each cache has this enable client logs flag that you can turn on. So, this would actually create a log file of the client side as well, similar log file that you've seen. So, I think that helps on the logging side of things. I'll take 10 more minutes and then I'll conclude on the performance counters because that's the most important section that we have.
NCache Performance Monitoring (Scenarios)
How to do the performance monitoring with the NCache? I hope it's not too much of information. I've kept it basic but the scenarios are something which aligns with your daily use cases.
Real-time Monitoring through PerfMon
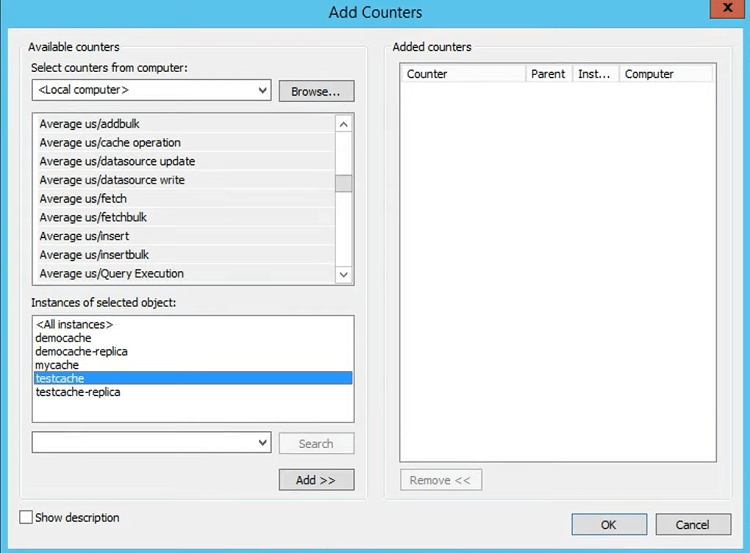
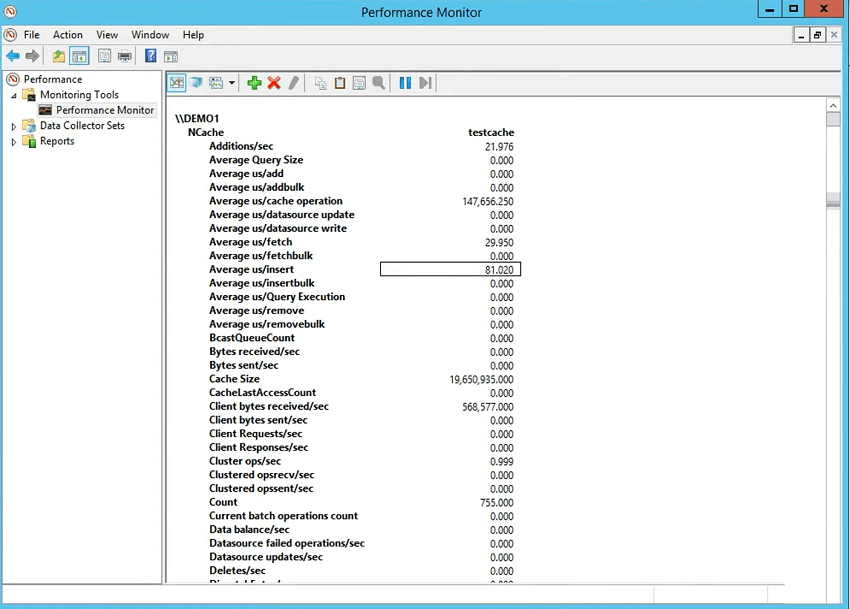
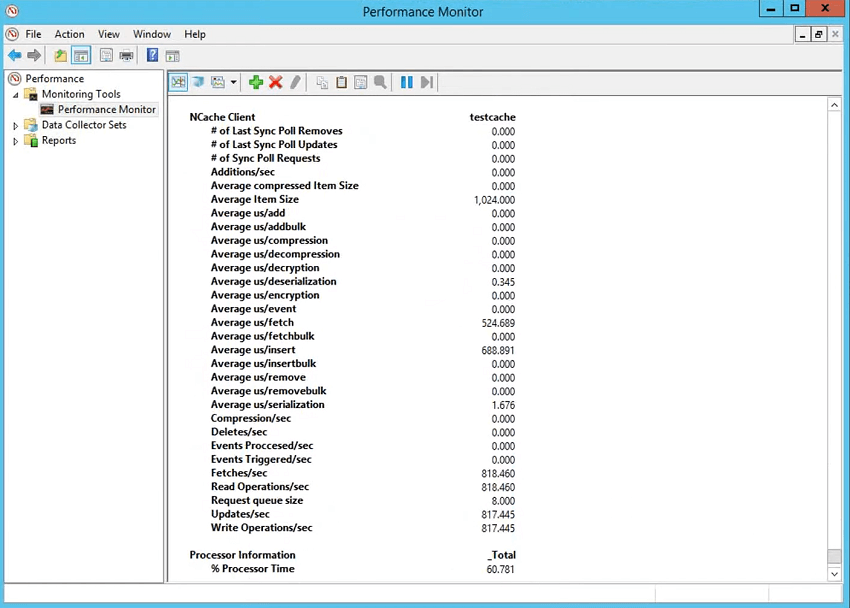
Now, coming back to the performance monitoring, NCache gives you two kinds of counters. These are PerfMon counters so you could just say PerfMon and hoping the performance monitor inside NCache and let me just close this right here and run a stress this tool real quick so that we save time. So, if I open the performance counter, we have NCache category, right? Under NCache category, we have all the counters that we need. The averages are very important. This gives you the average amount of time for add, fetch, insert in the Cache. So, I'll just use all of these, right? And, choose Add and choose okay and then I'll show you these performance averages.
So, you see average microsecond for fetch is 27 microseconds, average microsecond for insert it's 65 around. But, what about the client?
So, let's have a look at the client-side counters that how much time it's taking to complete in an operation. So, you choose NCache client category, choose test Cache for the client and then you choose add. So, underneath here, you would see NCache client section as well and this is the most important because this gives you the NCache client-side performers estimation. It gives you the item size so it's 1024 It gives you average microsecond per fetch 718 and that's the overall time and application took inside your application to serialize, if compression is on to compress, if encryption is on to encrypt and then send it across the wire, got stored over there so server time is included and then it came back and then de-serialize. So, that's the time of an operation. For fetch, it's just de-serialization. For insert, it's this serialization as well and you could actually see average microsecond per serialization for inserts and average microsecond per de-serialization for fetches.
And, you could also enable logs around these and that's what I would actually do, right now. I'll see if I can open, for some reason we should you died down on me, but let's see if I can do that. And, in this particular scenario, what I have in mind is, I have a web application which is… All right! this is doing something so… I have a web application I was hoping to… OKAY! There is a question. Can these NCache counters be accessed remotely? Of course! I access counters from server as well as from the clients all the time so if you have access to these servers remotely, the perf-mon access is allowed. You can actually do that. So, not a problem. So, it's usually one server as a monitoring server which takes care of all these tasks. I should have opened the visual studio beforehand and spawned the application but I didn't so that's what it is causing the issue. I hope this works this time. There you go! I think we're in not there actually. So, let me just put the directory of my project… Please bear with me. I'll just take a minute. This is a very interesting portion. I really want to showcase this. let's see if this gets picked up. There you go!
Logging PerfMon Data Collector Sets
Now, this application is designed in such a way that I'll be experimenting with different object sizes, right? And, based on that, I will log the performance counters and show you how the object size increases and have the performance drops. So, that would actually present a use case in your application, how to get notified or how to know when there is an application issue. So, what I'll do is I'll start the logging, right? So, I'll just use a stresses tool to check if I am able to connect to my cache. I'll just take five ten more minutes so please let me know if we're okay on the time. If there are any issues we can always. So, I think we're good on that. I just ran it so that we have… So, this should actually start my application. There you go! And, now I'll use my machine right here. And, I'll start the logging of perf-mon counters and for that you can use actually user collector set. For real-time monitoring, perf-mon counters are there, right? Which you could actually click on here and add them in the life. But, that really doesn't help in order to tackle an issue. When the application performs slowly, how to tackle that?
So, I just create a data collector set, right? Test 11, right? I created manually, use performance counters and I'll use the sampling interval to be one second and add NCache client counters to be precise because this is my application box. You could also use one other thing. Let me just add NCache counters, NCache client. Let me just use the stresses tool one more time so that this test Cache gets initiated. There you go! Add and I can close the stresses tool now, choose okay and in the meantime, I hope… All right! Something went down with this.
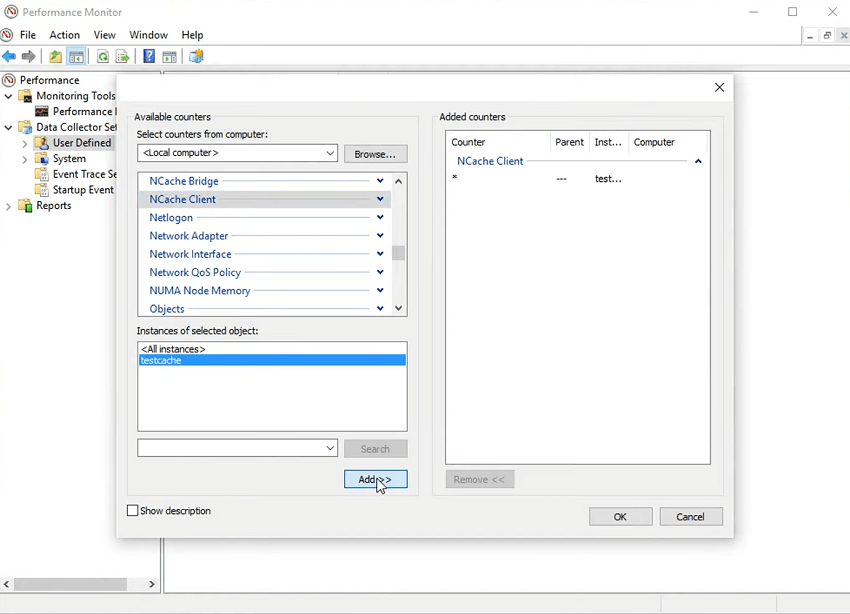
Anyway! So, I'll quickly choose next on this browse and choose a friendly location which I can pick, for example, let's use this and choose Okay, Next, Save and Close. And, so test 11 has been created. You could actually come here and start the collector set and, in the meantime, for some reason my web application didn't run. So, I'll just run it one more time. Interesting… All right! About to show what happened. I should have actually run it. That's what I did yesterday and it worked absolutely fine so I'll just give it one try. I think I have some pipeline mode issue so it's not going to run with this so I'll just skip this. What I can do is I can show you the data of this which I used from yesterday. So, if I come here, the design of this is in such a way that we have three kinds of tests, right? 10 KB, 50 KB, 100 KB and 10 500 KB so if you go through the 10 KB object it actually simulates the load of Get and Inserts of 10 KB so I ran it for 10 KB, 50 KB, 100 KB, 500 KB and then I'll log the counters, right? So, inside E, test one.
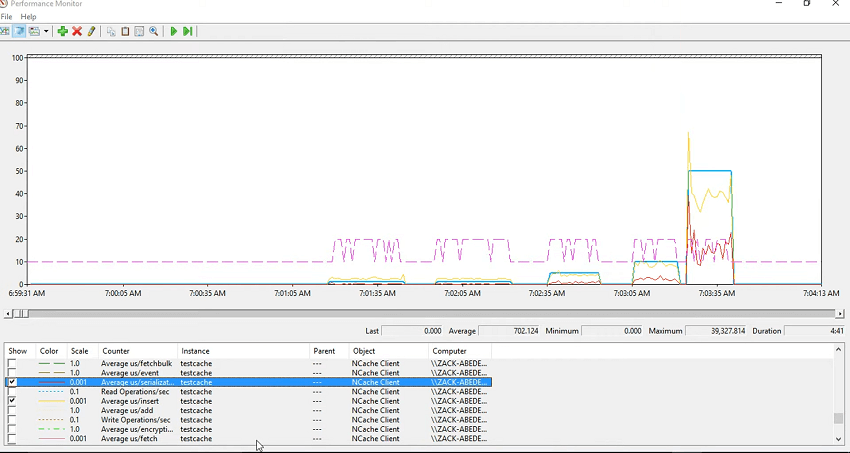
Okay! There you go! So, I ran this test and I really wanted to showcase the issues so if I just say control+A, hide selected counters and then for test cache, it actually consumes all the other counters as well. So, you first of all check the average item size so first test ran for 1 kilobyte 10 kilobyte again for 10 kilobyte then for 50 kilobyte then 400 kilobyte and then towards the end I ran it for 500 kilobyte. So, that explains the item size.
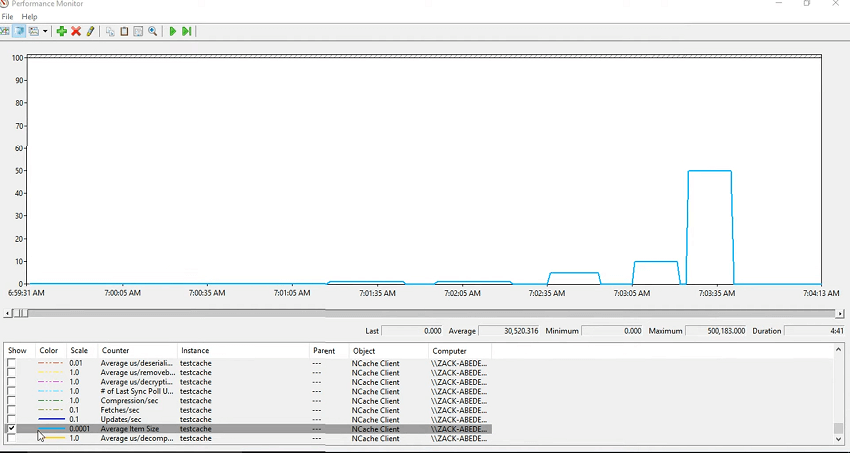
Now let's see the average amount of time it took for the fetch. So, there is a counter called average microsecond per fetch. So, you could see that it took it got increased over a period of time, right? So, fetch and then same for these because this is the same and then as you added the item size increased. The amount of time to fetch that item also increases along with it. But, what about the, since you're fetching it, so there should be a de-serialization overhead to it. So, that's covered here. So, most of the time is actually spent in the de-serialization of that so you could actually plot the de-serialization alongside that. So, these had most of the time spent in de-serialization and that's why it's slow.
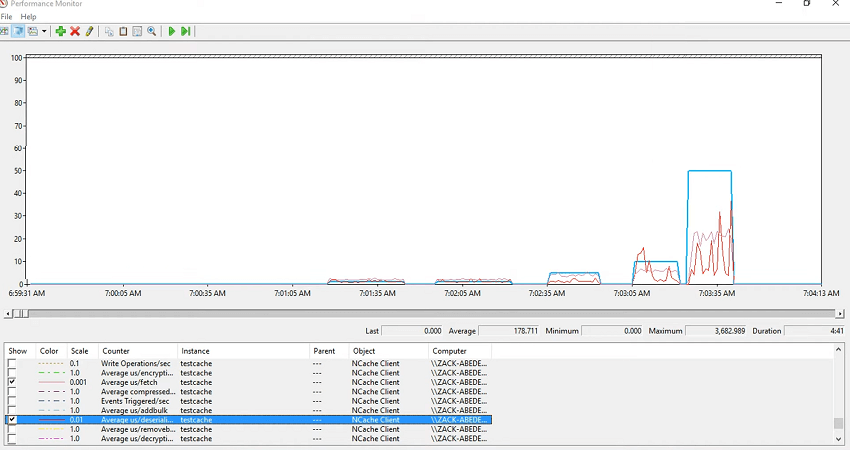
Now, I'll just look at the insert averages, average microsecond per insert and you could see that that would also vary with… There you go! So, we have insert taking some time and as you added the item size increase and the insert took time. So, in your application, if you see the application is slowing down, right? So, you log these counters and you just check whether it's the serialization, it's de-serialization, it is fetch or it's the insert or it’s remove or it's the request queue size which is actually growing. So, each time there is an activity there are some items in the request queue size and you would see that those would get cleared each time you process that. So, for inserts, let's have a look at the average microsecond per serialization, so that's the overhead. Let me just make it red and colored and you could see that it's the serialization which is actually impacting the averages.
So, overall average microsecond per insert, fetch, remove, on the client side give you an estimation of the performance that your application is exhibiting and at the same time you could log these counters and then have a look at that. Unfortunately, I couldn't run my application but this is from yesterday. I had a webinar yesterday where I successfully ran it and we ran it with 10 KB again 10 KB, 50 KB, 100 KB and 500 kilobyte. So, we could see the varying difference between the performances and this is way to tackle any performance issues that you check and cache counters and this has to be coupled with your application counters so you always need your application counters to be selected alongside that.
For example, you could see ASP.NET counters for a web application, right? ASP.NET applications. Typically, for .NET CLR memory we also see if there's a memory contention application can go down. So, you could log system counters and then log NCache counters as I did and then take it from there so that completes our performance monitoring sections.
Conclusion
We're about five minutes above our regular time marker. I hope that's okay because of the issues. This is a hands-on webinar so, it is expected that you would see such issues but just to summarize it we went through creating a cache, we showed you the NCache monitoring tool, health, event log entries, email alerts, NCache logs, log analyzer tool, client-side API logs and then I also showed you the perf-mon counters which are available on the server side. Server-side counters are there for server-side statistics and the client-side counters are there for clients-side statistics. I didn't spend a lot of time in explaining those counters. I should have been doing that but I'll do that in our next webinar for the same topic.
And, towards the end, I showed you how to pinpoint any issues by using the spikes or by using the perf-mon counter logging with the NCache. I hope it was informative, it was interesting.