| < Previous page | Next page > |
NCache Monitor Defining Dashboard
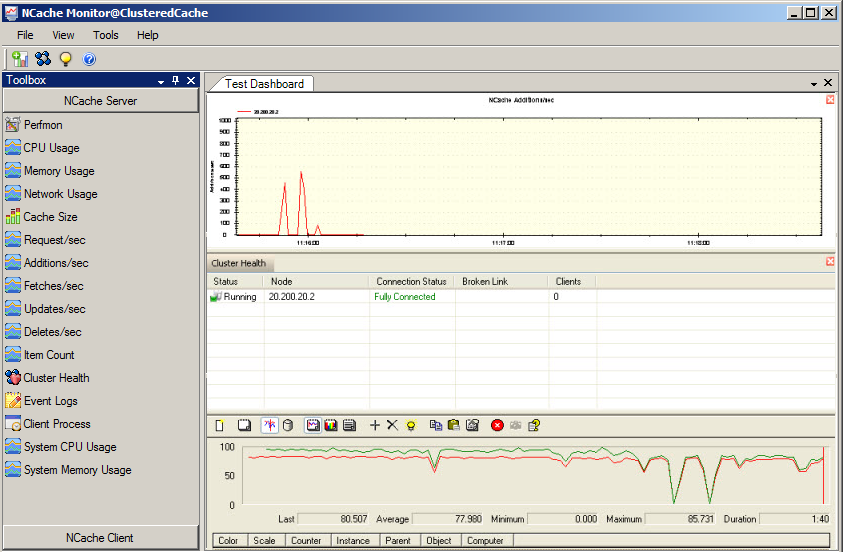
After selection of a cluster in NCache Monitor, now you can either use the default dashboards for monitoring performance, health or events of cache cluster or you can create your own dashboards according to your needs. Default dashboards cannot be modified, however you can make any modifications in your own dashboards.
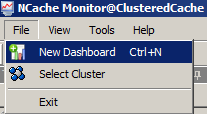
Step 1
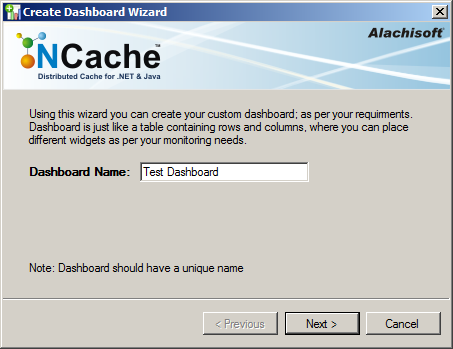
Step 2
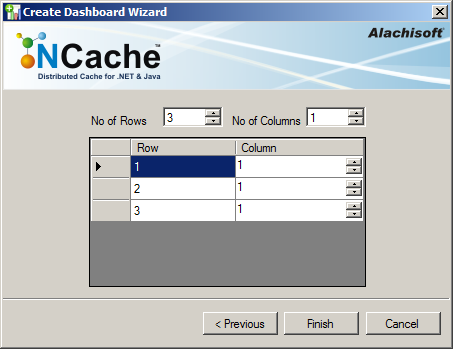
Step 3
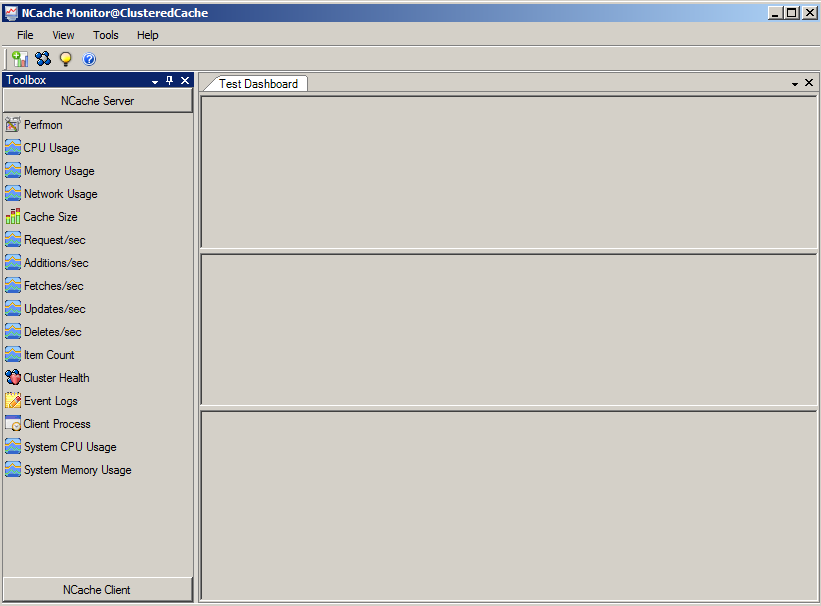
Step 4
Toolbox contains different counters for monitoring performance, health and events of a cache cluster. Widgets are categorized in two groups that are:
See Also
|