NCache Monitor provides you the facility to set the properties for different views. 'Options' menu provide various preferences to customize NCache Monitor graphs and lists. You can access the option dialog from Tools --> Options.
Step 1
-
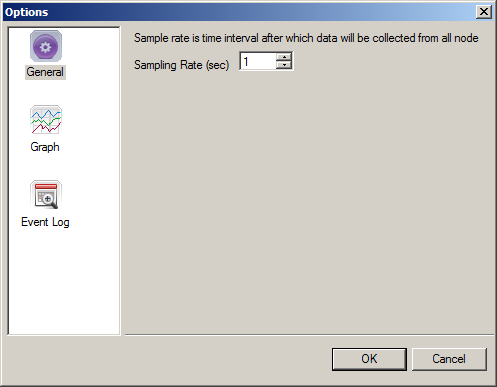
Tools --> Options --> General.
-
Using Options --> General screen you can set Sampling Rate value for a graph. Sampling rate is the time after which the data will be collected from all the nodes connected to the cache cluster for monitoring performance.
-
Enter the Sample Rate value and press OK button to apply the changes.
Step 2
-
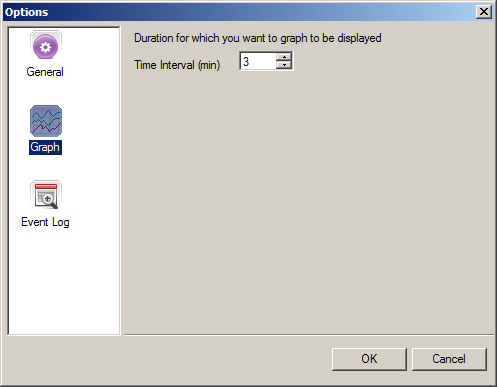
Tools --> Options --> Graph.
-
You can also set the Time Interval (x-axis value) for a graph to be displayed using the following screen. For example if you specify time interval of 3 minutes then dashboard will show 3 minutes performance graph at one time.
-
Enter the Time Interval value and press OK button to apply the changes.
-
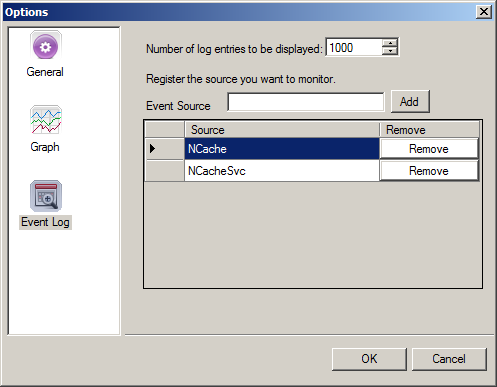
Tools --> Options --> Event Logs.
-
This option dialog is used to register the sources for which you want to monitor events. The events logged against registered sources can be seen in Event Logs at dashboard. Every application logs its events to event viewer with its unique source name.
-
Source is the application that logged the event, which can be either an application name such as NCache, or a component of the system or a large application such as ASP.NET.
-
Enter the number log entries you want to display in option dialog at Log entries to display text box.
-
To register a source you need to enter the source name in Event Source text box.
-
Press Add button to add the source in the Source list.
-
You can also remove the source using Remove button.
See Also