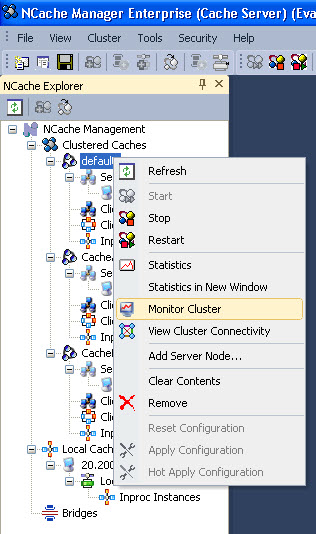
You can launch NCache Monitor in two ways:
Following are some of the main operations you can perform using NCache Monitor:
-
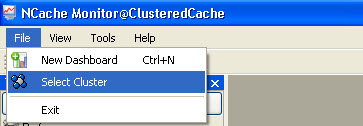
NCache Monitor provides you the facility to monitor various resources. The first step which needs to be performed is the selection of a cluster. 'Select Cluster Wizard' appears at the start up of the application or using the File --> Select Cluster option.
-
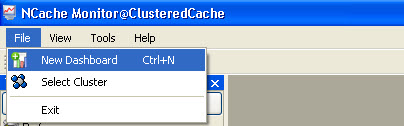
After selection of a cluster in NCache Monitor, now you can either use default dashboards for monitoring performance, health or events of cache cluster or you can create your own dashboard according to your requirements.
-
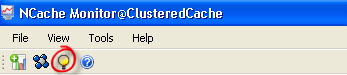
You can highlight the graph line for clear visibility using the icon shown in the figure below. To highlight the graph first select Highlight icon from the tool bar and then select the line you want to highlight in a graph (in case of multiple nodes).
-
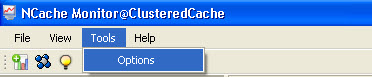
NCache Monitor provides you the facility to set properties for different views. 'Options' menu provide various preferences to customize NCache Monitor graphs and lists. You can access the option dialog from Tools --> Options.
See Also