| < Previous page | Next page > |
New Dashboard
Item Count Graph
This graph shows number of items in the cache against cache instances. The category of this graph is NCache and the counter is Count.
Additions/sec Graph
This graph shows the number of Add operations per second. It is against the cache instance. The category of this graph is NCache and the counter is Addition/sec.
Fetches/sec Graph
This graph shows the number of Get operations per second. It is against the cache instance. The category of this graph is NCache and the counter is Fetches/sec.
Updates/sec Graph
This graph shows the number of Insert operations per second. It is against the cache instance. The category of this graph is NCache and the counter is Updates/sec.
Deletes/sec Graph
This graph shows the number of Remove operations per second. It is against the cache instance. The category of this graph is NCache and the counter is Deletes/sec.
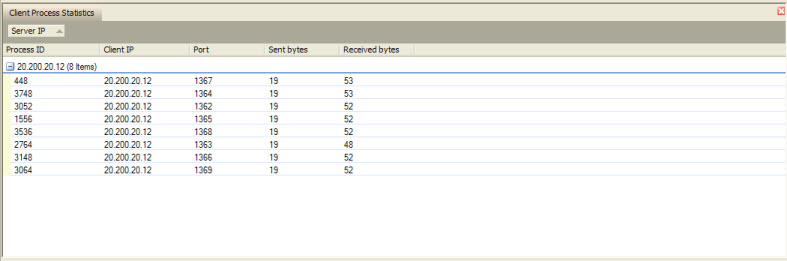
Client Process Statistics
Here you can monitor the processes running on different clients connected to the selected cluster. It displays information in a list having following values:
In Client Process Statistics list you can group the statistical data on the basis of any parameter listed above. For grouping we need to drag the parameter to the Drag space. For example the following figure shows the grouping of process on the basis of Server IP. You can also undo the grouping by dragging the parameter back from a drag bar to the list.
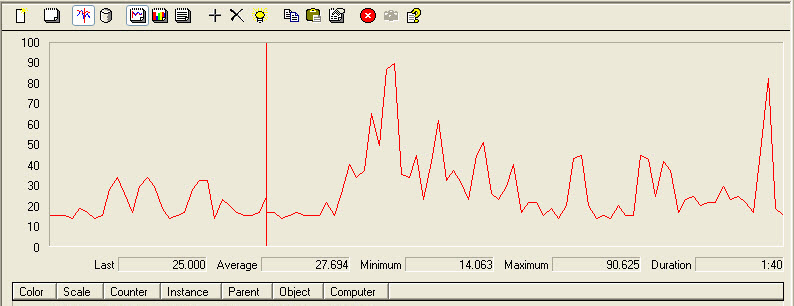
System CPU Usage
% Processor Time is the percentage of elapsed time that the processor spends to execute a non-Idle thread. It is calculated by measuring the duration in which an idle thread is active in the sample interval and subtracting from total interval (Each processor has an idle thread that consumes cycles when no other threads are ready to run). This counter is the primary indicator of processor activity, and displays the average percentage of busy time observed during the sample interval. It is calculated by monitoring time the that the service is inactive, and subtracting that value from 100%. It is against the Total instance. The category of this graph is Processor and the counter is % Processor Time.
System Memory Usage
Committed Bytes is the amount of committed virtual memory, in bytes. Committed memory is the physical memory which has space reserved on the disk paging file(s). There can be one or more paging files on each physical drive. This counter displays the last observed value only; it is not an average. The category of this graph is Memory and the counter is Committed Bytes.
PerfMon Control
Perfmon is used for general purpose counters which are not provided by us. Here you can add any counter for monitoring the performance. Perfmon is a normal windows control and can be used in a same way. All the added widgets will be saved on closing the NCache Monitor.
See Also
|