| < Previous page | Next page > |
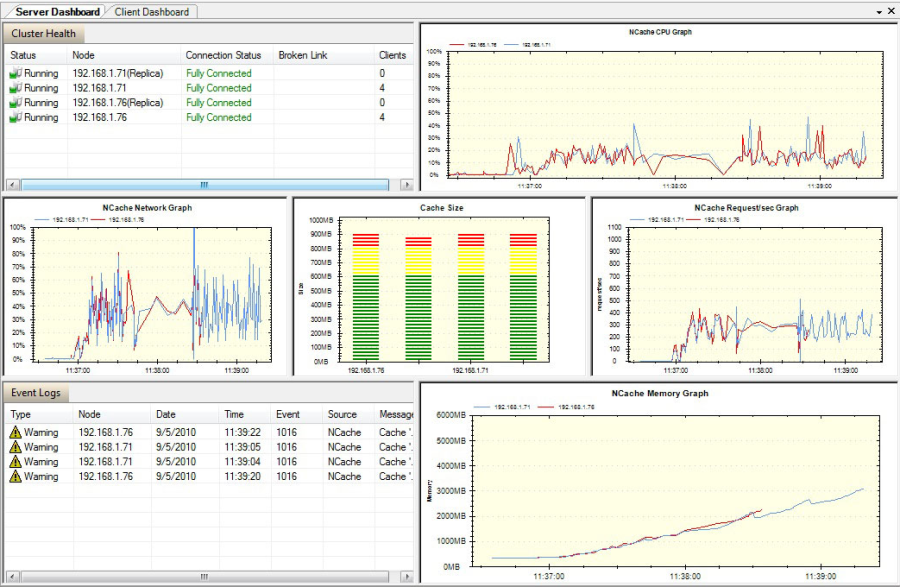
Server Dashboard
Dashboard provides different types of views for monitoring various counters. Views are specific to the counters. After selection of a cluster in NCache Monitor, you can either use default dashboard for monitoring performance, health or events of cache cluster or you can define your own dashboard according to your needs. Server Dashboard is one of the default dashboards which appears automatically after the selection of a cluster. Server dashboard cannot be modified, however you can retrieve server dashboard any time from View option. Server dashboard contains following graphs:
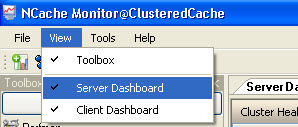
You can view the cluster Dashboard from the following option:
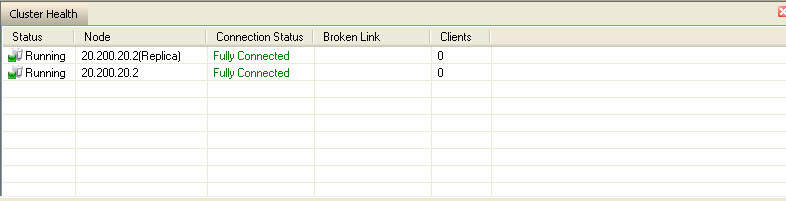
Cluster Health
Cluster health shows the connection status among the nodes of a cluster. It displays information in a form of list having following values:
NCache CPU Graph
NCache CPU graph shows CPU cycles consumed by NCache Server.
NCache Network Graph
NCache Network Graph contains two counters:
Cache Size Graph
Cache Size graph shows cache data against the total capacity of the cache.
NCache Request/sec Graph
Number of requests received (meaning cache commands like add, get, insert, remove etc.) from all clients by this cache server.
NCache Memory Graph
Private Bytes is current size of the memory in bytes that shows this process has allocated and cannot be shared with other processes.
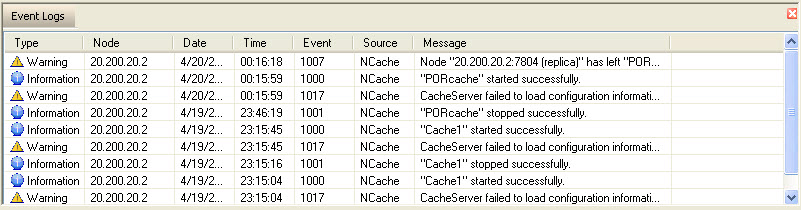
Events Logs
Here you can monitor events of all registered sources. Source can be any software that logged the event, which can be either an application name such as NCache, or a component of the system or a large application such as ASP.NET. Event log service records all the events in the Application logs. The Application log contains events logged by applications or programs. For example, a database program might record a file error in the Application log. The program developer decides which events to record.
Event Viewer : A component you can use to view and manage event logs.
Any event of a registered source fired will be shown with respect to the node in Event Logs view. It contains the following values:
See Also
|