NCache
Installation Guide
Getting Started
Administrator's Guide
Configuring Caches
Configuring Bridge for WAN Replication
Programmer's Guide
Client Side API Programming
Troubleshooting
| < Previous page | Next page > |
Monitoring Client Process of a Cache Cluster Using Custom Dashboard
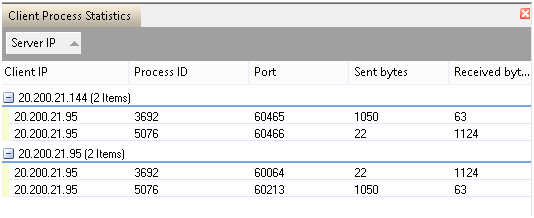
Client Process control shows details of running client applications against current cache. Details include client IP, process ID, port, server IP with which this client application is connected and Sent/Received bytes by each client.
Follow the steps given below to add Client Process control in a custom dashboard:
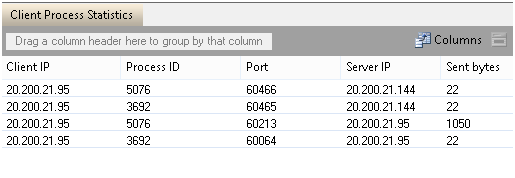
Information of all the currently connected clients displayed in Client Process control for current cache.
See Also
Monitoring Cache Server Counters Using Built-In Dashboard| Monitoring Cache Client Counters Using Built-In Dashboard | Monitoring Cache Cluster Counters Using Custom Dashboard| Monitoring Cache Event Logs Using Custom Dashboard |Monitoring Perfmon Counters Using Custom Dashboard | Monitoring Caches Using NCache Monitor | ASP.NET Session Monitoring Using Custom Dashboard | Monitoring Bridge Using NCache Manager | Monitoring NCache Using Windows Perfmon Tool | Configuring NCache
|