NCache 4.4 - Online Documentation

Monitoring Bridge Counters Using Perfmon Tool

 
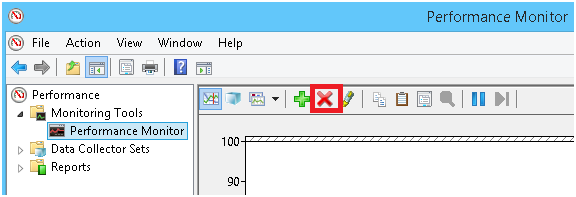
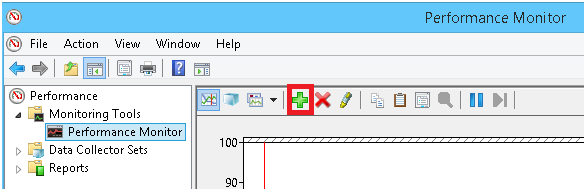
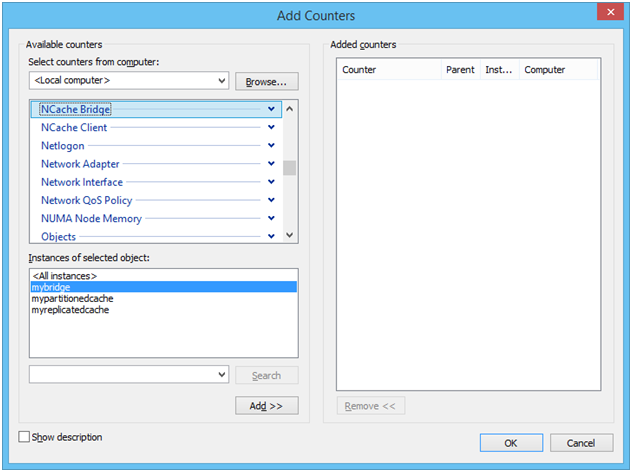
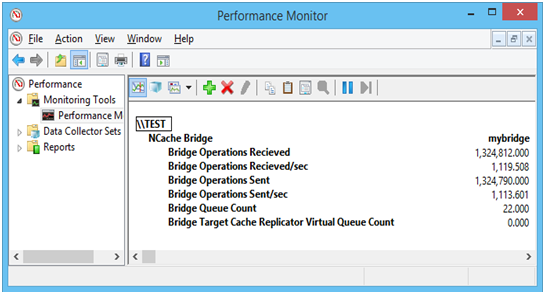
NCache publishes bridge counters in perfmon under category NCacheBridge. This category has all the counters related to the bridge. Follow these steps to monitor the NCache bridge counters through perfmon tool:
 
  • Press WINDOWS + R keys on your keyboard OR click on the windows start menu and then type perfmon and press ENTER key.
  • Perfmon tool opens up. Click on the Performance Monitor under Monitoring Tools.
 
 
  • Click on the cross (X) button to remove the default counter which is already added in it. Then click on the plus (+) button to open the Add Counters dialog box.
 
 
  • Using the vertical slider of available counters list box, scroll upward to find NCache Bridge category.
 
 
  • Click on the down arrow head (icon) to expand the NCache Bridge category. All of its counters are listed under it.
  • All of the current running instances of bridge appear inside of Instances of selected objects list box. Select the required instance or simply click on the <All instances>, and click on the Add >> button. All of the counters that were selected in step 5 for all the selected instance of caches appear in Added counters list box on the right side.
  • Click OK. All of the selected counters will appear in perfmon tool like this:


See Also