| < Previous page | Next page > |
Monitoring Cache Client Counters Using Built-In Client Dashboard
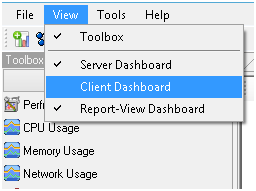
NCache Monitor also provides built-in dashboard named as Client Dashboard. This dashboard has all required
counters/graph in it for the clients’ performance monitoring. It can be viewed for monitoring as follows:
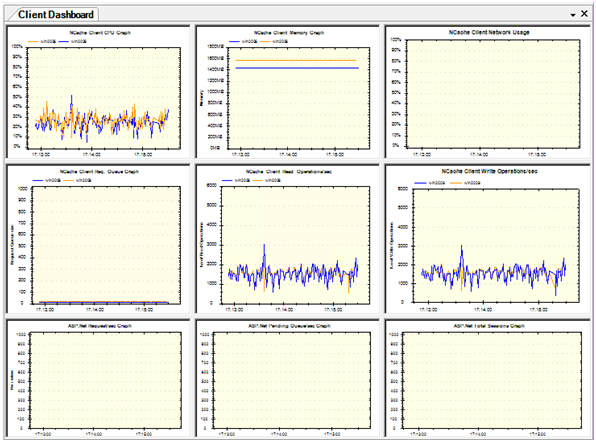
This built-in dashboard displays different client side counters. Few of the counters display the NCache client system resource usage info like NCache Client CPU, NCache Client Memory, NCache Client Network. This dashboard also shows the NCache client specific information like NCache Client Request Queue, NCache Client Read Operations/sec, NCache Client Write Operations. It also shows the ASP.NET session counters like ASP.NET Requests/sec, ASP.NET Pending Queue/sec, ASP.NET Total Sessions.
See Also
Monitoring Cache Server Counters Using Built-In Dashboard| Monitoring Cache Cluster Counters Using Custom Dashboard | Monitoring Perfmon Counters Using Custom Dashboard| Monitoring Cache Event Logs Using Custom Dashboard |Monitoring Client Process of a Cache Cluster Using Custom Dashboard | Monitoring Caches Using NCache Monitor | ASP.NET Session Monitoring Using Custom Dashboard | Monitoring Bridge Using NCache Manager | Monitoring NCache Using Windows Perfmon Tool | Cache Counters
|