Monitoring Dashboards Using Azure VMSS
After deploying and configuring your NCache environment, you can monitor the performance and health of your cluster using Azure Dashboards. These dashboards provide insights into cache activity, server performance, and request metrics.
Warning
Azure dashboard are not vaery instantaneous and metrics may take up to 5 minutes to appear. For real-time monitoring, use native NCache monitoring.
View Monitoring Dashboards
- Navigate to the Azure Portal Home Page.
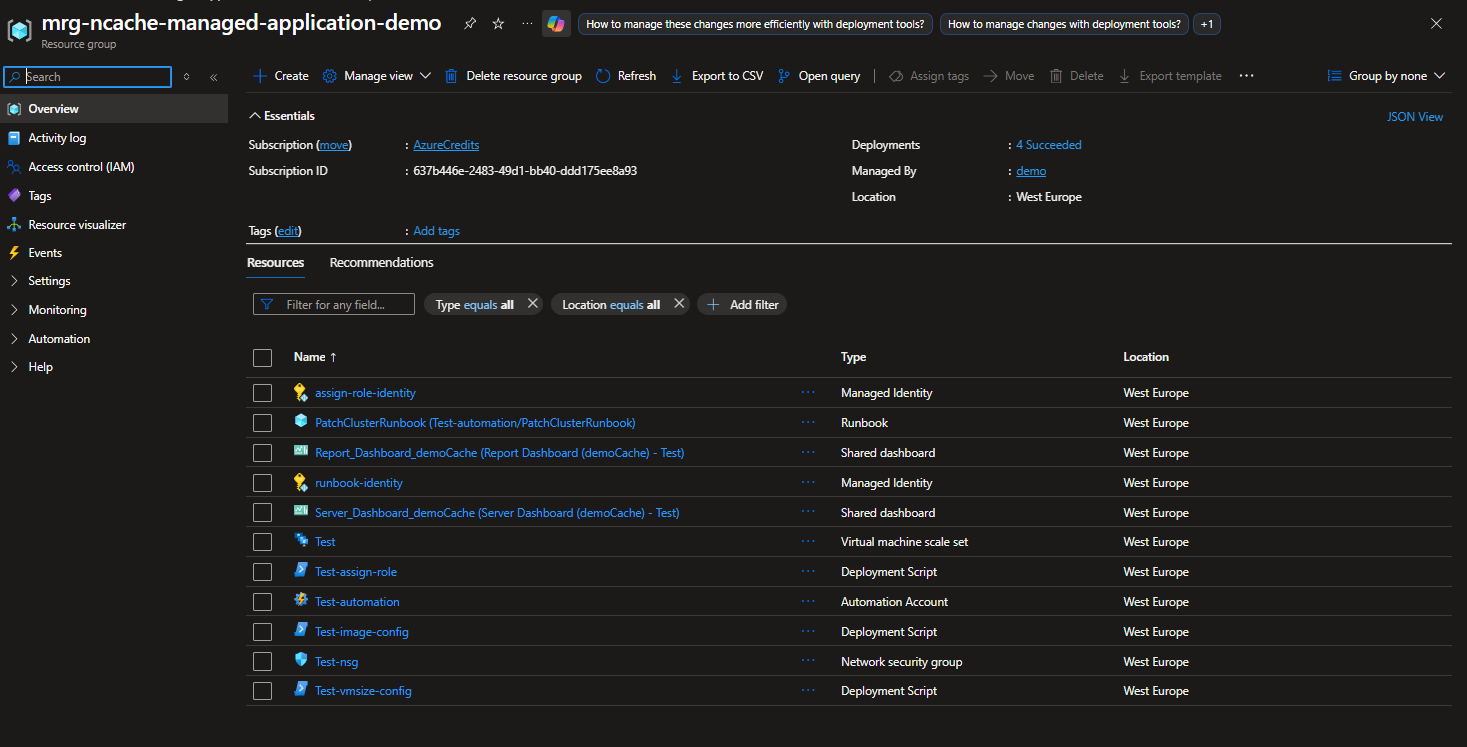
Open your Managed Resource Group, and select the dashboard you want to view. As NCache offers two dashboards Server Dashboard and Report Dashboard.
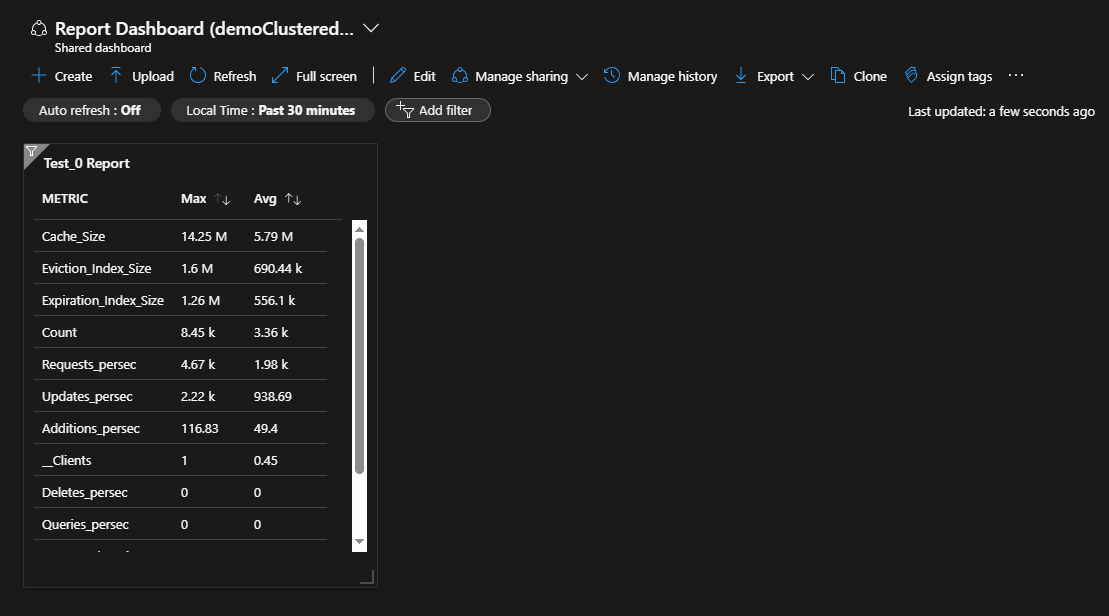
To view the Report Dashboard you will select the report dashboard which is Report_Dashboard_demoCache(Report Dashboard(demoCache)) here. After selecting this, click View Dashboard, it will appear as follows:
Similarly, to view the Server Dashboard you will select the server dashboard which is Server_Dashboard_demoCache(Server Dashboard(demoCache)-Test) here. After selecting this, click View Dashboard, it will appear as follows:
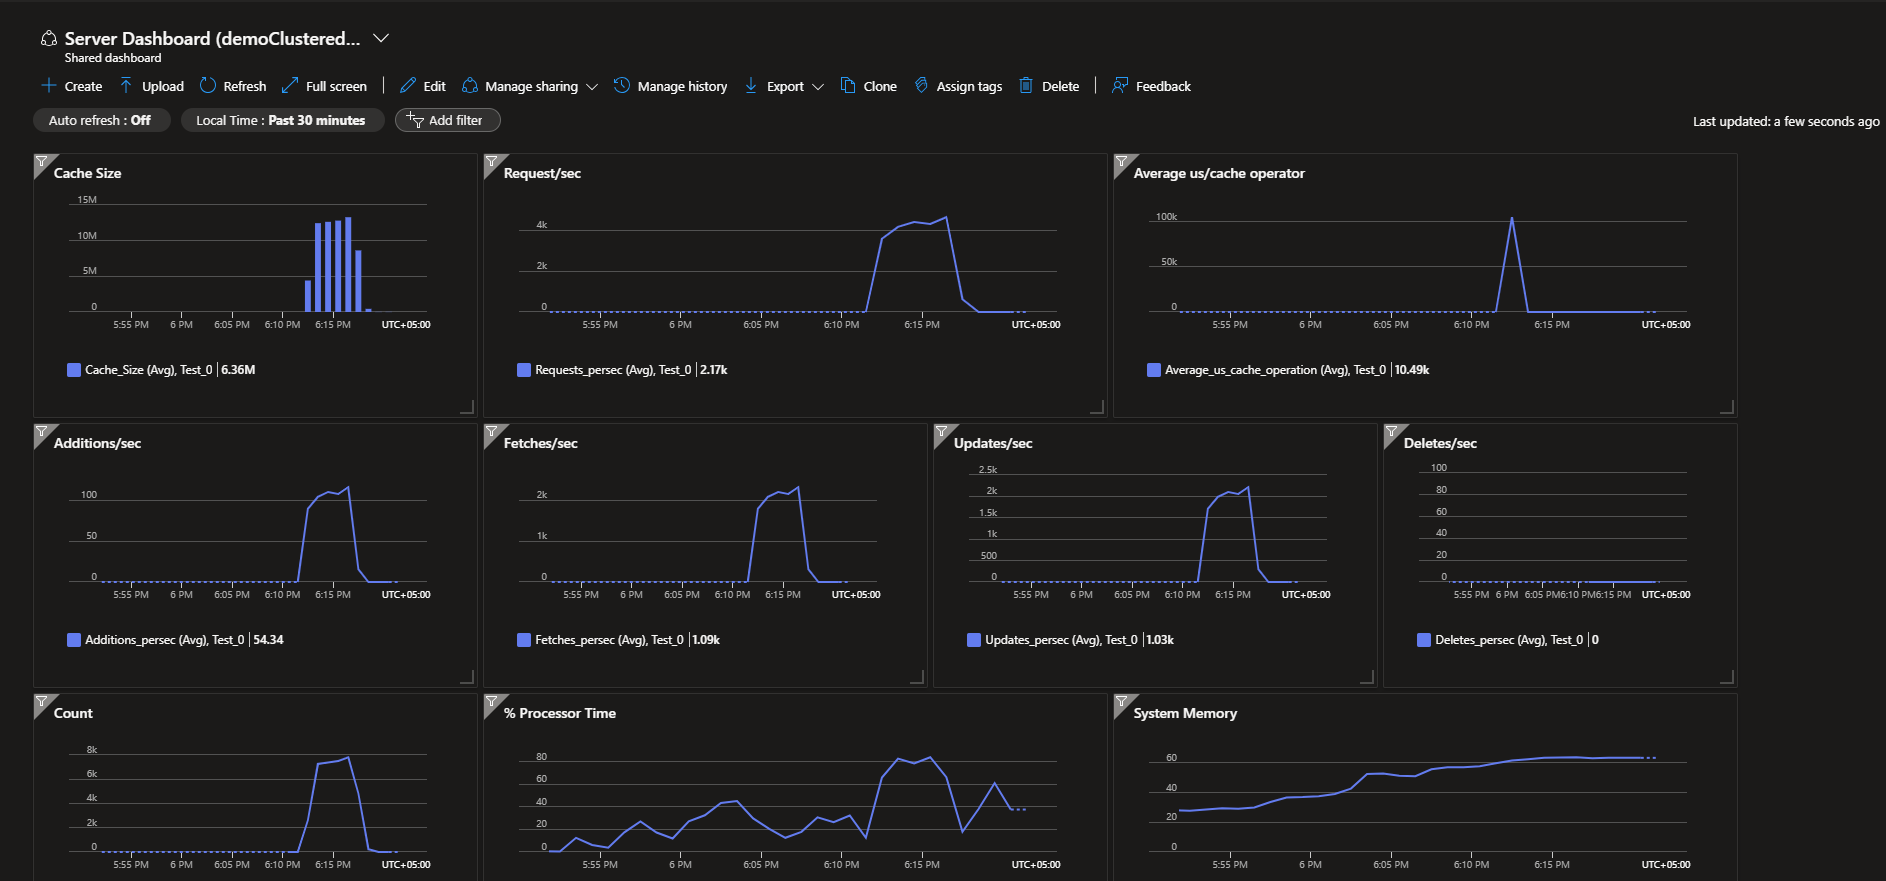
The dashboard displays graphical metrics such as:
- Requests per second
- Fetches per second
- Updates per second
- Deletes per second
- Average cache operation time
Please note that these dashboards are not very instantaneous and take almost 5-minutes to load data. For real-time monitoring please use native NCache monitoring.
Validate Monitoring Data
To verify that metrics are being collected correctly, you can perform cache operations or run a test workload using the Test Stress tool. As activity increases, the dashboard graphs will begin to reflect the changes after a short delay.
Important Considerations
- Monitoring data may take a few minutes to appear after deployment or after enabling monitoring.
- Ensure that the cache is actively being used; otherwise, graphs may appear empty or flat.
- Metrics are collected per instance and aggregated at the dashboard level.