Monitoring Cache Server Counters Using PerfMon
Monitoring NCache Cache Server Counters through Windows Performance Monitor (PerfMon) provides real-time insight into the health and performance of your distributed cache cluster. NCache publishes a comprehensive set of metrics under the NCache PerfMon category, enabling administrators to monitor request throughput, memory usage, and cluster synchronization. By using PerfMon, one can proactively identify bottlenecks, ensure high availability, and optimize resource management for NCache server nodes. NCache provides Cache Server Counters in PerfMon under the category NCache. This category has all the counters related to the cache server.
Prerequisites
Make sure the NCache Service is started. If it is not, proceed with the following (run as admin):
In PowerShell, enter the following command:
Start-Service -Name NCacheSvc
For .NET Core, make sure that you run NCache Service as an administrator. Here are the steps to do so:
- Open the Services window and look for NCache in the list.
- Right click on NCacheSvc from the list and choose Properties.
- Go to the Log On tab and click on the Browse button.
- In the object name field, type Administrator and click on the Check Names button.
- It will pick the appropriate Administrator, then click OK.
- Now, set a Password and click OK.
- Right click on the NCache Service and choose the Restart option. Now your service will start running as Administrator.
- Ensure your caches are running.
How to Configure and Monitor NCache Counters in PerfMon
Follow the steps given below to monitor the NCache Counters through the PerfMon tool:
Press the WINDOWS + R keys on your keyboard or click on the Windows start menu, then type PerfMon, and press ENTER key.
The PerfMon tool opens up. Click on the Performance Monitor under Monitoring Tools.
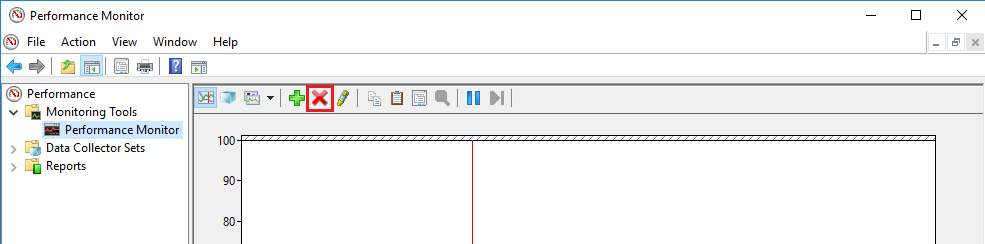
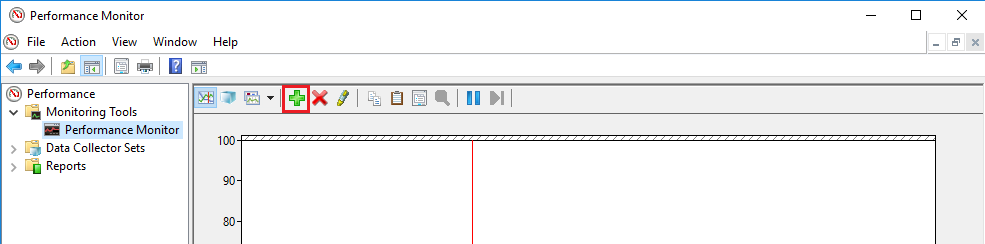
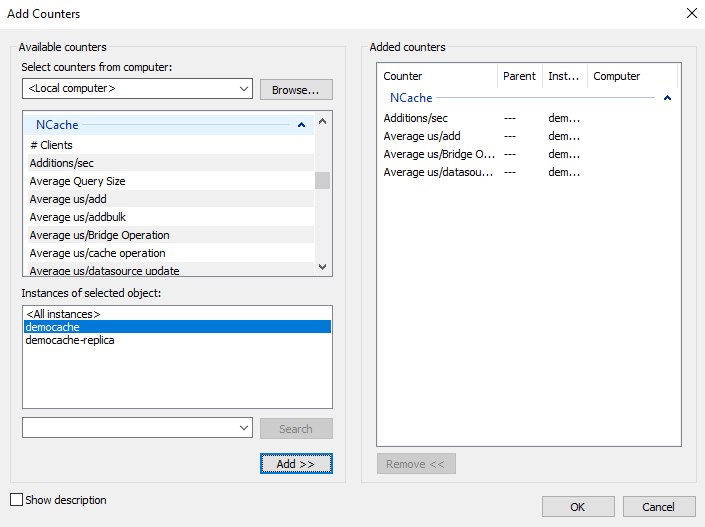
- Click on the cross (X) button to remove the default counter which is already added to it. Then click on the plus (+) button to open the Add Counters dialog box.
- Using the vertical slider of the available counters list box, scroll upward to find the NCache category.
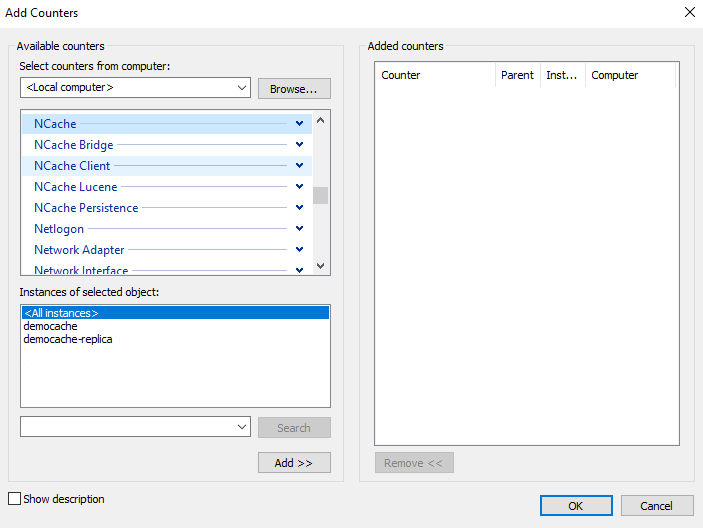
- Click on the down arrowhead icon to expand the NCache category. All of its counters are listed under it. Select the required counters from this list like this:
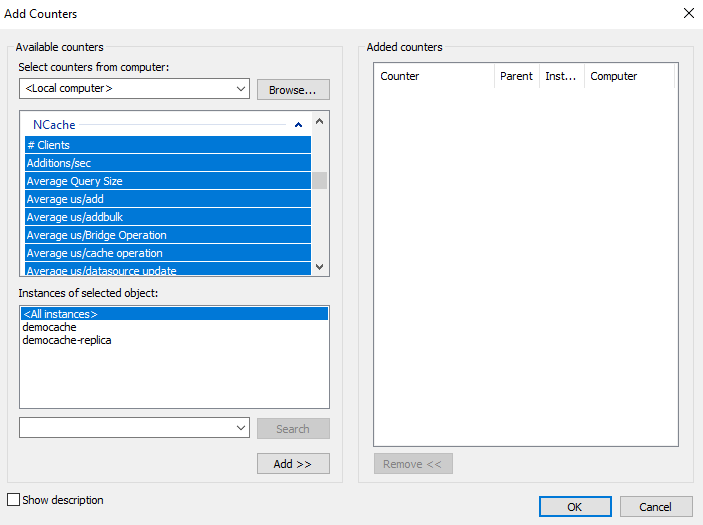
All of the current running caches (and replicas of caches) appear inside of Instances of selected objects list box.
Select the required instance or simply click on the
and click on the Add >> button. All of the above selected counters for all the selected instances of caches appear in the Added counters list box on the right side.
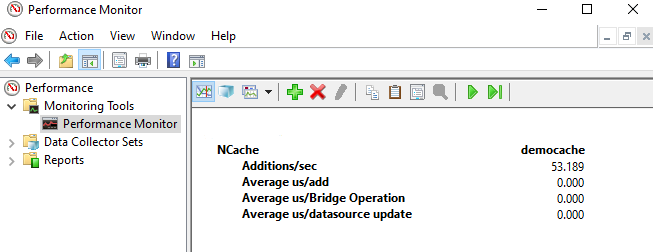
- Click OK. All of the selected counters will appear in the PerfMon tool like this:
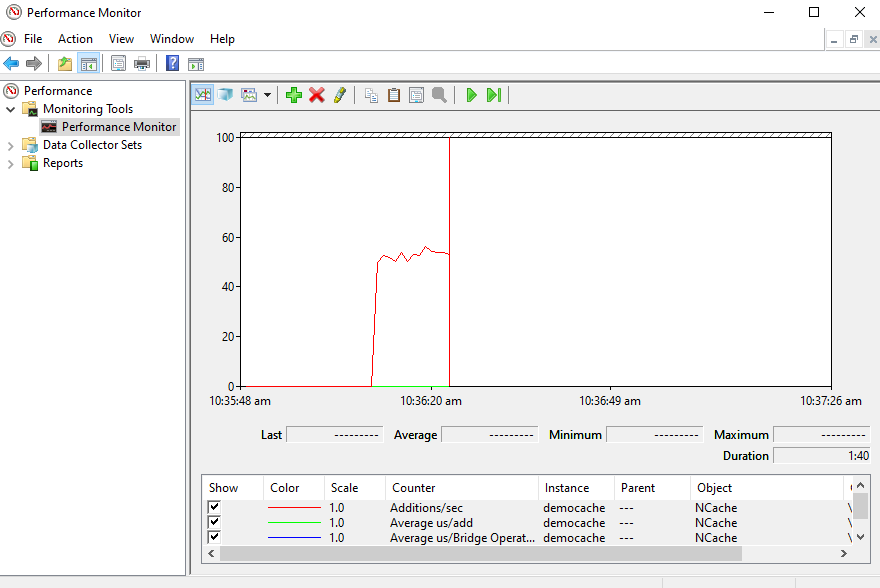
You can also change the view of PerfMon from Report view to Line view.
Click on the Line option in the drop-down menu. This changes the PerfMon view from Report to Line. In Line view, counter values are displayed in the form of a continuous graph, like this:
See Also
Monitor Cache Client Counters Using PerfMon
Monitor Bridge Counters Using PerfMon