• Products
  • Solutions
  • Customers
  • Resources
  • Company
  • Pricing
  • Download
Try Playground
  • Monitor Caches
  • Monitor NCache using the NCache Management Center
  • Using Monitoring Dashboards
  • Monitor with a Built-In NCache Monitor Dashboard
Show / Hide Table of Contents
  • Administrator's Guide
  • NCache Architecture
    • Cache Topologies
      • Partitioned Topologies
      • Replicated Topology
      • Mirrored Topology
      • Scalability in Topologies
    • Dynamic Clustering
    • Local Cache
    • Cache Client
    • Client Cache
    • Bridge for WAN Replication
    • Connectivity with Load Balancer
    • Serialization Format
    • Data Encryption
    • Data Compression
    • Data Load Balancing
    • Pipelining
    • Cache Server Backward Compatibility
    • Client Backward Compatibility
    • Eviction
    • Indexing
    • Split-Brain
    • Maintenance Mode
    • Runtime Data Sharing
    • Portable Data Types
    • Class Versioning
    • IP Binding with Multiple NICs
    • Graceful Node Down
    • Separate Cache Host Process
    • Self Healing Dynamic Clustering
    • Distributed Cache with Persistence
  • NCache Management Center
  • Configure Caches
    • Create a Cache
      • Local Cache Overview
        • Local Cache
        • Local Cache with Persistence
        • Pub/Sub Messaging Cache
        • Add Existing Cache
      • Clustered Cache Overview
        • Distributed Cache
        • Persistent Distributed Cache
        • Pub/Sub Messaging Cache
        • Add Existing Clustered Cache
        • Troubleshooting
    • Remove Cache
    • Clear Cache
    • Add Server Node
    • Remove Server Node
    • Add Test Data
    • Configure Query Indexes
    • Configure JSON Query Indexes
    • Compact Serialization
      • Non-Generic Registration
      • Non-Generic Unregistration
      • Generic Registration
      • Using Type Handler
    • Deploy Providers
    • Configure Custom Dependency
    • Add Data Source Providers
      • Read-Through Provider
      • Write-Through Provider
      • Write-Behind Provider
    • Loader and Refresher
    • Configure Maintenance Mode
      • Stop for Maintenance Mode
      • Exit Maintenance Mode
    • Configure LINQPad
      • Configure LinqPad for NCache
      • Querying Data in LinqPad
  • Configure Clients
    • Add Client Node
    • Remove Client Node
  • Configure Client Cache
    • Create Client Cache
    • Create Client Cache with NuGet
    • Enable Client Cache on Client Nodes
    • Disable Client Cache on Client Nodes
    • Remove Client Cache
  • Management Operations
    • Start Cache
    • Stop Cache
    • Restart Cache
    • Manage Cache Service on a Server Node
    • Memory Dumps
    • Data Load Balancing
    • Invoke Refresher Dataset
    • Import/Export Cache Data
    • Import Lucene Indexes
    • Suspend/Resume NCache Data Persistence
    • Backup and Restore NCache Persisted Data
  • Cache Settings
    • General Cache Settings
      • Cache Size
      • Cache Isolation Levels
      • Cache Serialization Format
      • Cache Data Expiration
    • Cache Cluster Settings
      • Ports
      • Operation Timeout
      • Configure Pipelining
      • Static Replication Interval
      • Connection Retries
      • Retry Interval
      • Split-Brain Auto Recovery
    • NCache Persistence Settings
      • Store Information
      • Persistence Interval
    • Error Logging
    • Cache Level Events
    • Client Activity Events
    • Eviction Policy
    • MapReduce
    • Register Classes for Portable Data Sharing
    • Compression
    • Email Notifications
    • Bind IP with Multiple NICs
      • Bind Cluster with a Dedicated IP
      • Bind Client/Server with a Dedicated IP
    • Heartbeat
    • Keep Alive
    • Client Death Detection
    • Communication Reliability
    • Auto Start Cache on Boot
    • Nagle's Algorithm
    • Dual Socket
    • Configuration Files
      • Client Side Configurations
        • Client Config
        • EFCaching Config
      • Server Side Configurations
        • Cache Config
        • Bridge Config
        • Modules Config
        • Security Config
        • TLS Config
        • Monitoring Config
        • Emails Template
  • Cache Server Settings
    • Server Connectivity
    • Bind to Multiple NICs
    • Server Ports
    • Memory
    • Custom Dependency
    • Request Inquiry
    • Windows Events
    • Message Events
    • Expiration & Eviction
    • SQL Server
    • Logging
    • Monitoring
    • Persistence Data Loading Retries
    • Miscellaneous Configurations
  • Bridge Server Settings
  • Cache Client Settings
  • Client Cache Settings
  • Configure Security
    • Configure Authentication and Authorization
    • Configure Encryption for Cache
    • Configure TLS Encryption
    • Configure HTTPS for NCache Management Center
  • Configure Bridge for WAN Replication
    • Create Bridge
    • Add Clustered Caches to Bridge
    • Configure Bridge Settings
    • Change Cache Synchronization Modes
    • Bridge Management
    • Synchronize Caches in Bridge
    • Leave Bridge
    • Remove Cache from Bridge
    • Configure Conflict Resolver
  • Setup Database for Cache Synchronization
    • Setup SQL Server Environment
    • Setup Oracle Database Environment
    • Setup OleDb Environment
    • Setup SQL Server for CLR Procedures
  • Simulate NCache Usage
  • Monitor Caches
    • Counters
      • Distributed Cache Counters
      • Distributed Cache with Persistence Counters
      • Pub/Sub Messaging Cache Counters
      • Distributed Lucene Cache Counters
      • Cache Client Counters
      • Bridge Counters
    • Monitor NCache using the NCache Management Center
      • Using Tabular Statistics
        • Configure Counters to Display Caching Statistics
        • Configure Counters to Display Pub/Sub Statistics
        • Configure Counters to Display Lucene Statistics
        • Configure Counters to Display Bridge Statistics
        • Browse Cache Statistics
        • Monitor Bridge
      • Using Monitoring Dashboards
        • Configure Monitor Settings
        • Configure Event Logging
        • Configure API Logging
        • Monitor with a Built-In NCache Monitor Dashboard
        • Monitor with the NCache Monitor Custom Dashboard
        • Monitor Cluster Connectivity
        • Monitor Cache Clusters using NCache Email Alerts
    • Monitor Cache Using Command Line Tools
      • Monitor Cache Server Statistics with Command Line Tools
      • Monitor Cache Client Statistics with Command Line Tools
    • Monitor NCache Using Windows PerfMon Tool
      • Monitoring Cache Server Counters using PerfMon
      • Monitoring Cache Client Counters using PerfMon
      • Monitor Bridge Counters Using PerfMon Tool
    • Monitor NCache using Prometheus
    • Monitor NCache using Grafana
    • Monitor NCache Using SNMP Counters
    • Monitor NCache Using JMX Counters
    • Logging
      • NCache Log Viewer
      • Performance Counters Logging
      • Windows Event Logging
      • Cache Health Alerts
      • Email Notifications on NCache Events
      • Cache Server Logging
      • Client Side API Logging
      • Cache Event IDs
      • Feature Usage Logging
    • Troubleshooting NCache Monitoring
      • Computer Name Not Found
      • Diskperf Not Installed
      • No READ Access to Perflib Subkeys
      • Unable to Connect to Remote Server
    • IPV6 Support

Monitor Using a Built-In NCache Monitor Dashboard

You can use the built-in graphical dashboards to monitor your cache performance counters. This section will guide you on how to use these dashboards through the NCache Management Center.

Note

The default dashboard displays the counters based on your selected cache and its store type. You can monitor NCache Counters for caches with different store types by following the same steps.

Prerequisites to Monitor using a Built-In NCache Monitor Dashboard

  • Please ensure that the time on your server machine and the machine where the NCache Management Center runs is synchronized with the World Clock Time.
  • Ensure the NCache Service is started. If not, proceed with the following:
  • Windows Environment
  • Linux Environment

In command line tool of your choice, enter the following command:

Start-Service -Name NCacheSvc

For .NET Core, make sure that you run the NCache Service as an administrator. Here are the steps to do so:

  • Open the Services Window and look for NCache in the list.
  • Right-click on NCacheSvc from the list and choose Properties.
  • Go to the Log On tab and click on the Browse button.
  • In the object name field, type Administrator and click on the Check Names button.
  • It will pick the appropriate Administrator, then click OK.
  • Now, set a Password and click OK.
  • Right-click on the NCacheSvc and choose the Restart option. Now your service will start running as an administrator.

In a terminal of your choice, type the following command:

> sudo systemctl start ncached

Monitor Cache Counters

There are two major categories of cache performance counters; Server counters and Client counters.

In order to monitor cache counters, follow the steps below:

  • Launch the NCache Management Center by browsing to http://localhost:8251 or <server-ip>:8251 on Windows and Linux.

  • From the left navigation bar, click on the Clustered Caches or Local Caches based on your requirement.

Monitor using the NCache Management Center

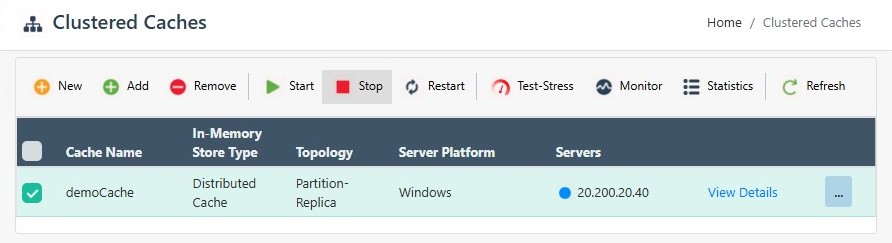
  • Click on the "..." button on the right corner against the cache name and click on Monitor Cluster. Make sure that the cache is already running.

Monitor Cluster

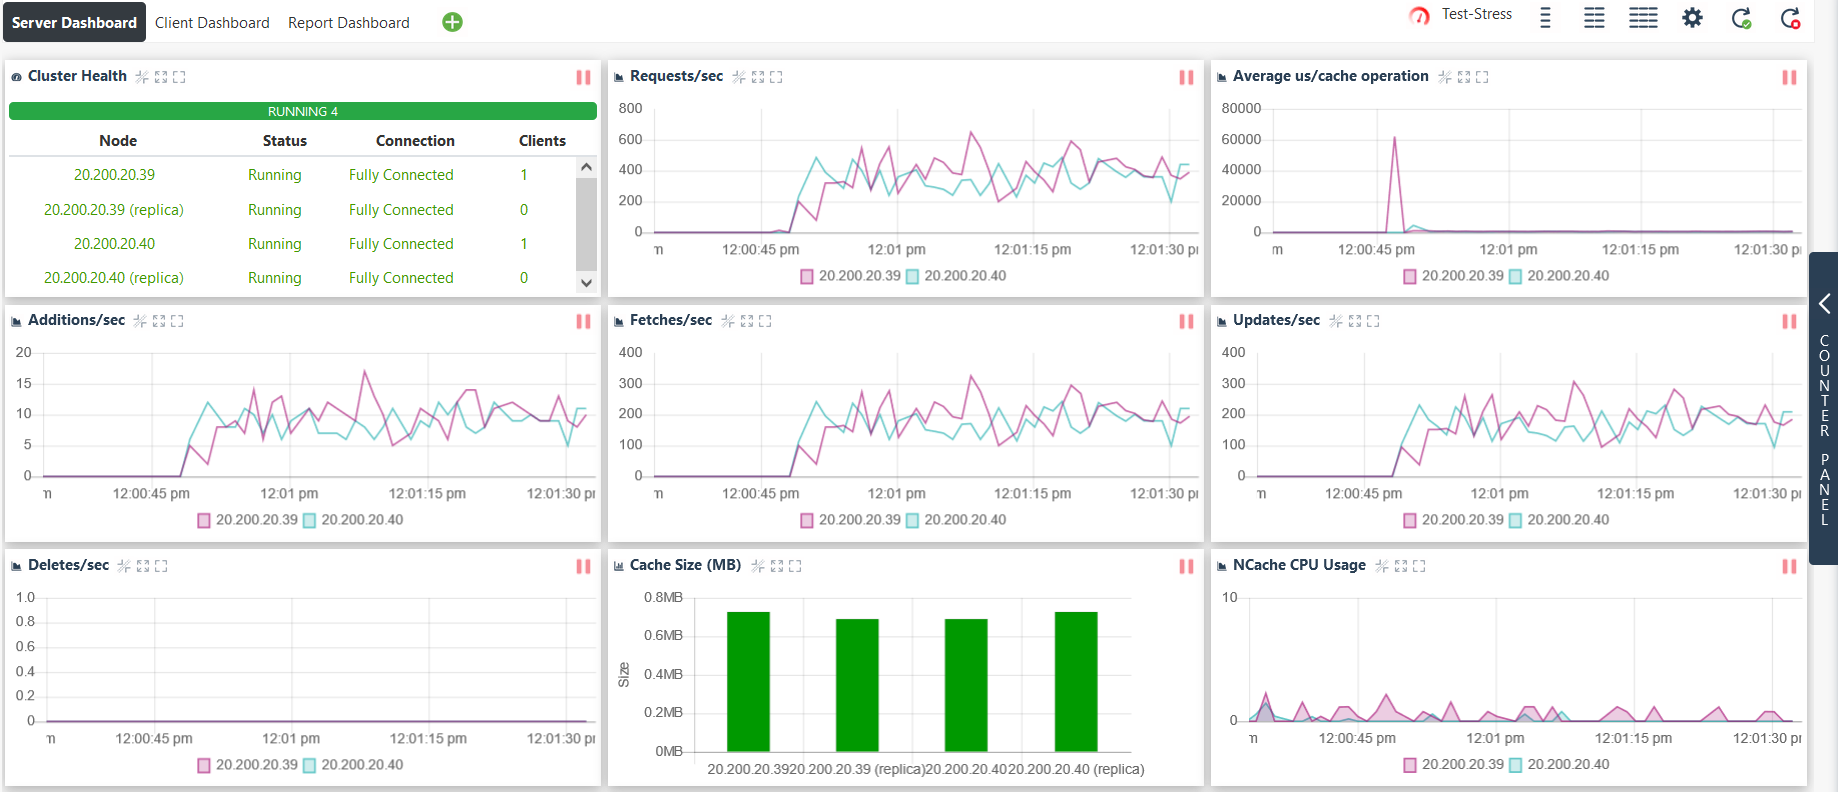
  • NCache Monitor will be opened in a new tab. By default, it has three dashboards opened.
Important

All the default dashboards are non-editable. It means no counter or graph can be added or removed from default dashboards.

Server Dashboard

It contains Cluster Health and Event Logs along with some mostly required cache counter graphs like, CPU Usage, Network Usage, Cache Size, Request/sec Graph, and Memory Usage, etc. The Server Dashboard is generally a graphical view dashboard.

Built-in Server Dashboard

Client Dashboard

This built-in dashboard displays different client side counters. For instance, a few of the counters display the NCache client system resource usage information like the NCache Client CPU, NCache Client Memory, and NCache Client Network. This dashboard also shows the NCache client-specific information, e.g., NCache Client Request Queue, NCache Client Read Operations/sec, and NCache Client Write Operations.

Built-in Client Dashboard

See Also

Monitor with Custom Dashboard
Monitor Caches using NCache Monitor
Monitor Cluster Connectivity
Monitor Using Test Stress

In This Article
  • Prerequisites to Monitor using a Built-In NCache Monitor Dashboard
  • Monitor Cache Counters
  • Server Dashboard
  • Client Dashboard
  • See Also

Contact Us

PHONE

+1 (214) 764-6933   (US)

+44 20 7993 8327   (UK)

 
EMAIL

sales@alachisoft.com

support@alachisoft.com

NCache
  • NCache Enterprise
  • NCache Professional
  • Edition Comparison
  • NCache Architecture
  • Benchmarks
Download
Pricing
Try Playground

Deployments
  • Cloud (SaaS & Software)
  • On-Premises
  • Kubernetes
  • Docker
Technical Use Cases
  • ASP.NET Sessions
  • ASP.NET Core Sessions
  • Pub/Sub Messaging
  • Real-Time ASP.NET SignalR
  • Internet of Things (IoT)
  • NoSQL Database
  • Stream Processing
  • Microservices
Resources
  • Magazine Articles
  • Third-Party Articles
  • Articles
  • Videos
  • Whitepapers
  • Shows
  • Talks
  • Blogs
  • Docs
Customer Case Studies
  • Testimonials
  • Customers
Support
  • Schedule a Demo
  • Forum (Google Groups)
  • Tips
Company
  • Leadership
  • Partners
  • News
  • Events
  • Careers
Contact Us

  • EnglishChinese (Simplified)FrenchGermanItalianJapaneseKoreanPortugueseSpanish

  • Contact Us
  •  
  • Sitemap
  •  
  • Terms of Use
  •  
  • Privacy Policy
© Copyright Alachisoft 2002 - 2025. All rights reserved. NCache is a registered trademark of Diyatech Corp.
Back to top