Monitor Cache Using the NCache Monitor Custom Dashboard
You can add a custom dashboard to configure and monitor cache performance counters based on your specific requirements. Using the NCache Monitor, you can create personalized dashboards by selecting server-side and client-side Counters, for both local and clustered caches. These custom dashboards are accessible through the NCache Management Center and support focused monitoring and targeted troubleshooting beyond the default dashboards.
Prerequisites
- Please ensure that the time on your server machine and the machine where the NCache Management Center runs are synchronized with the World Clock Time.
- Ensure the NCache Service is started. If not, proceed with the following:
To start the NCache Service on Windows, open Windows PowerShell as Administrator and run the following command:
Start-Service -Name NCacheSvc
Make sure that you run the NCache Service as an administrator. Here are the steps to do so:
- Open the Services window and look for NCache in the list.
- Right click on NCacheSvc from the list and choose Properties.
- Go to the Log On tab and click on the Browse button.
- In the object name field, type Administrator and click on the Check Names button.
- It will pick the appropriate Administrator, then click OK.
- Now, set a Password and click OK.
- Right click on the NCache Service and choose the Restart option. Now your service will start running as administrator.
Using the NCache Management Center
In order to create a custom dashboard and monitor its counters, follow the steps below:
Note
You can create a custom dashboard for different store types by following the same steps.
Launch the NCache Management Center by browsing to http://localhost:8251 or
<server-ip>:8251.From the left navigation bar, click on the Clustered Caches or Local Caches based on your requirement.
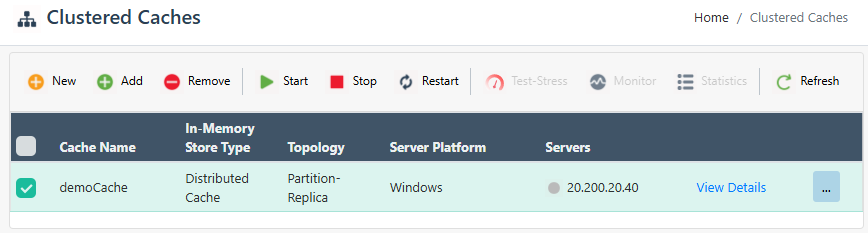
- Click on the "..." button on the right corner against the cache name and click on Monitor Cluster. Make sure that the cache is already running.

In the new tab, you will see a "+" button in the top bar.
On pressing the "+" button, a text box for the dashboard name and view will be provided.
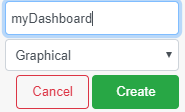
Provide the dashboard name and view (e.g., Graphical). Then click Create.
You will get a success message displayed on the screen at the creation of the dashboard.
Monitor Cache Counters
- After the creation of the dashboard, open the Counter Panel by clicking on the arrowhead on the right corner of the page.
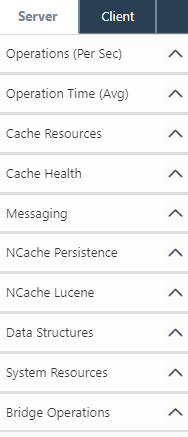
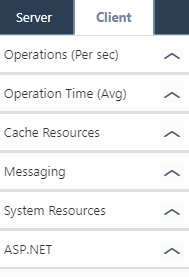
- From the list that will open, drag and drop the required counters from the Server or Client category.
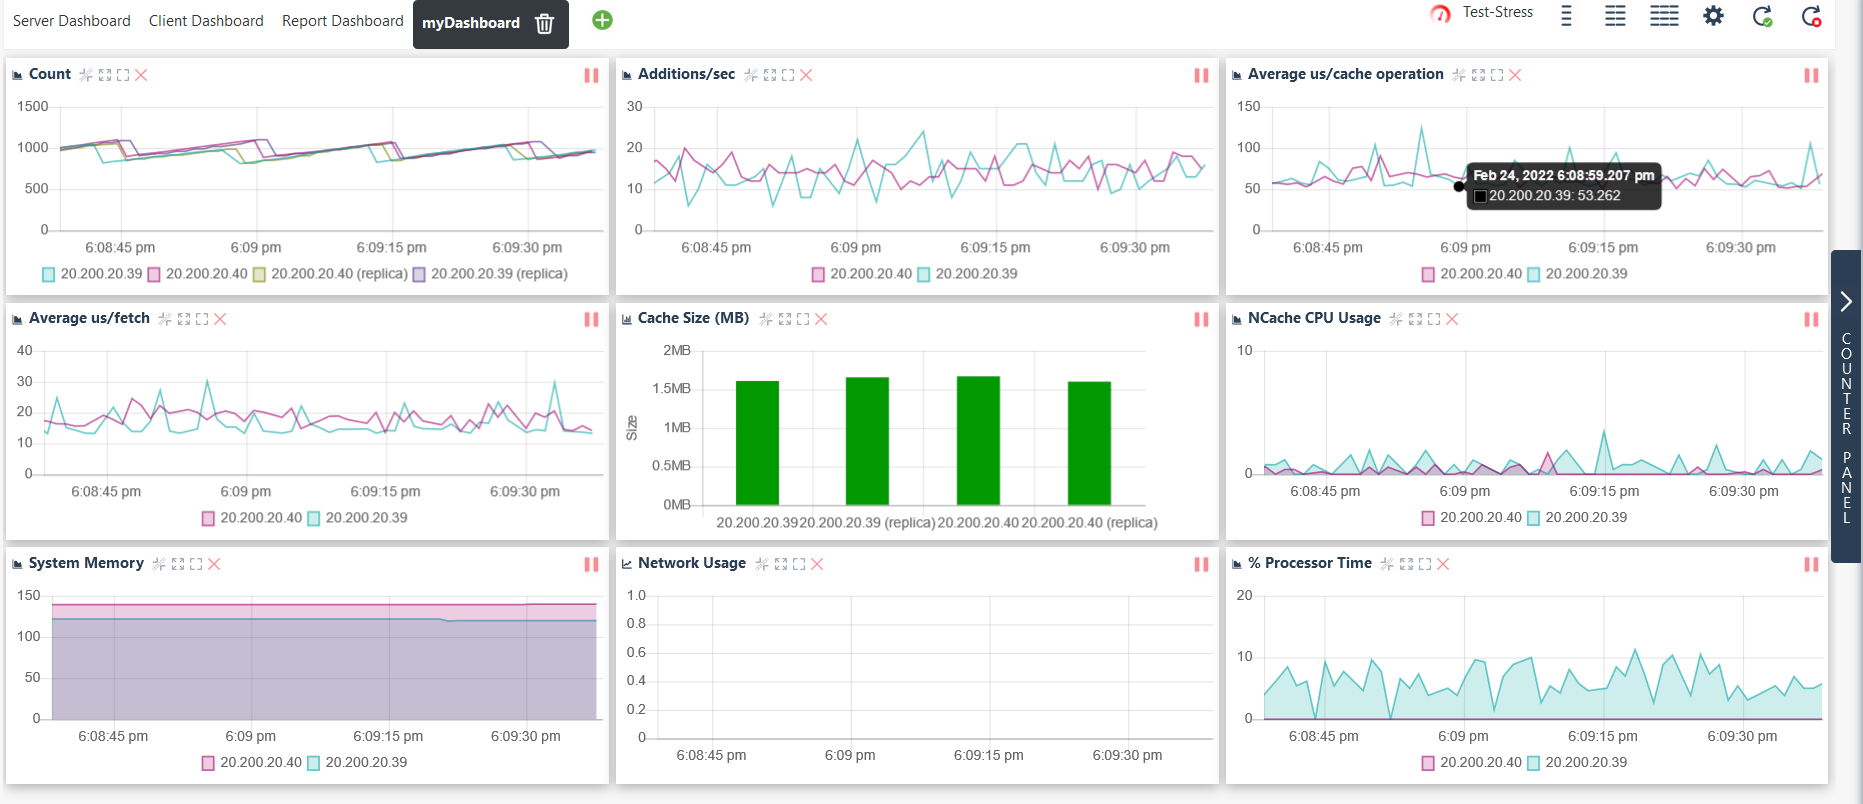
- The custom dashboard after dragging the various Client or Server counters will look like this:
Monitor Client Processes of Clustered Cache
The Client Process control shows the details of running client applications against the current cache. These details include the Client IP, Process ID, Port, and Server IP to which the client application connects, along with the bytes sent and received by each client.
Follow the steps below to monitor the client processes:
In your custom dashboard, open the Counter Panel by clicking on the arrowhead on the right corner of the page.
From the Server category, drag and drop the Client Process under the Cache Health list.
Information on all the currently connected clients will be displayed in the Client Process control for the current cache.
Monitor ASP.NET Sessions
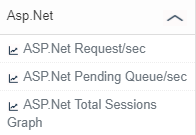
Using the NCache Monitor, you can also monitor the ASP.NET Session Counters. Currently, you can monitor the ASP.NET Request/sec, ASP.NET Pending Queue/sec, and ASP.NET Total Sessions counter in the Cache Monitor.
See Also
Monitor with Built-in Dashboard
Monitor Caches using NCache Monitor
Monitor Cluster Connectivity
Monitor Using Test Stress