Trace Events
Event Tracing is a high-speed logging facility used by operating systems and applications to capture system and software activity in real time. It allows developers and administrators to monitor software behavior, diagnose bugs, and analyze performance bottlenecks with minimal impact on system resources. Essentially, you can opt for Event Tracing over Logging when you need to analyze complex execution flows, capture precise timing, or understand system-wide causality, i.e., how an action moves through a complex system. Additionally, event tracing is very fast and has very little performance overhead.
In Event Tracing, a process represents the running application or service that produces specific trace events. Within that process, a source acts as a trace or event provider and typically represents a specific component, module, or subsystem responsible for emitting events. Each event generated by a source is recorded as a trace, which captures diagnostic details such as the event message, timestamp, severity level, event ID, and any related runtime information needed for monitoring, troubleshooting, or analysis. However, these traces are not generated unless there is a dedicated listener.
NCache provides this option across multiple configuration areas such as cache, client and service processes. The following is a complete list of the event sources available for this purpose:
Alachisoft.NCache.ClientAlachisoft.NCache.Caching/ClientCacheAlachisoft.NCache.Client/Continuous QueriesAlachisoft.NCache.Client/MessagingAlachisoft.NCache.Client/QueryIndexAlachisoft.NCache.Client/CacheEventAlachisoft.NCache.Cache/QueryIndexAlachisoft.NCache.Cache/StateTransferAlachisoft.NCache.Caching/CacheEventAlachisoft.NCache.SocketServerAlachisoft.NCache.Cache/Messaging
The concept is primarily recognized as Event Tracing for Windows (ETW), which is deeply integrated into the Windows OS and serves as a collection mechanism for these traces, though similar event tracing mechanisms also exist in Linux such as EventPipe. After configuring Event Tracing, you can use PerfView or dotnet-trace on Windows, and dotnet-trace on Linux to collect traces.
This page demonstrates using Event Tracing for Alachisoft.NCache.Cache/StateTransfer on Windows and Linux.
Note
ETW requires more OS privileges and is thus more powerful as compared to EventPipe.
How to Enable Event Tracing
Step 1: Download & Install PerfView
- Download PerfView.
- Run the executable file and accept the EULA agreement. The PerfView welcome screen will appear.
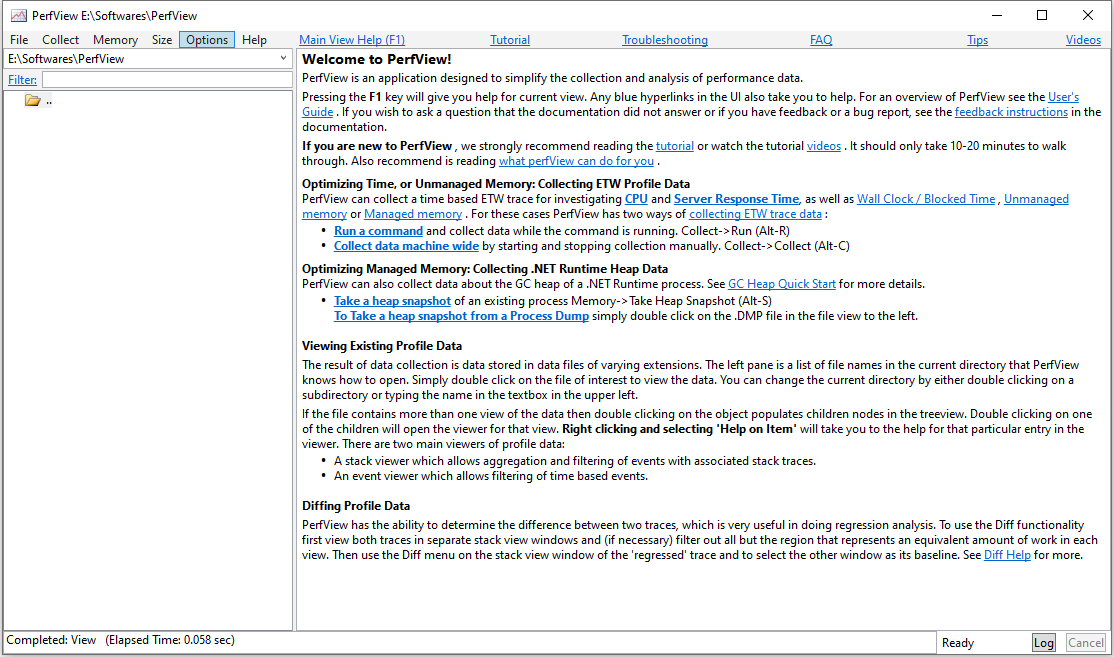
- Click Collect. A Windows permission prompt will appear asking whether you want to allow the application to make changes to your device. Click Yes to continue. This opens the initial collection screen.
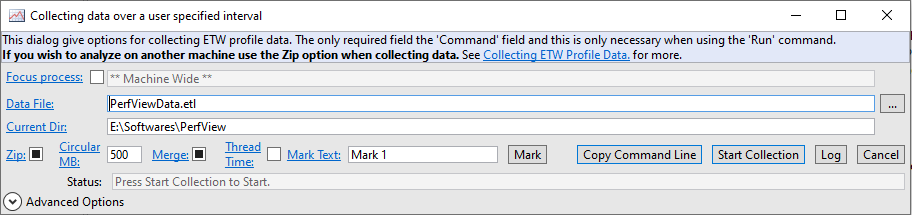
Step 2: Set Up & Start Collection
- On the collection screen, click Advanced Options. In the Additional Providers field, specify the required provider. For example:
Alachisoft.NCache.Cache/StateTransfer
Note
You can add multiple providers using a comma separated list.
Then, click Start Collection.
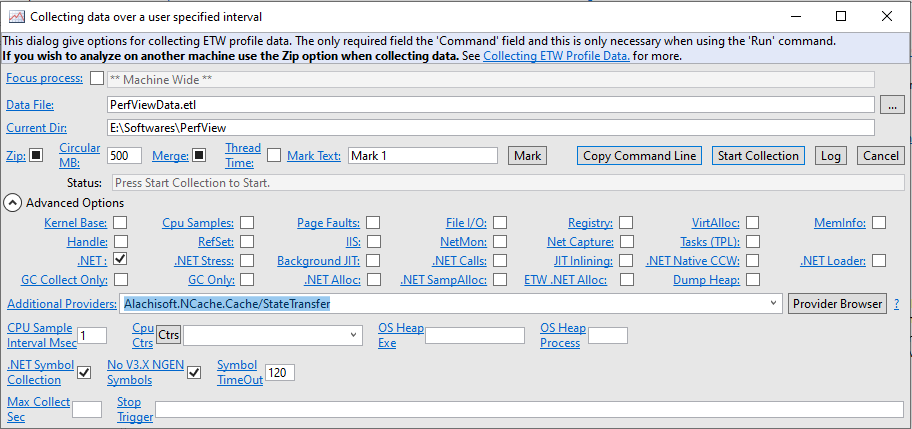
Step 3: Analyze Collection
- The lower-right corner of the main PerfView window displays the collection status. When you have captured the required trace data, click Stop Collection. After a few moments, PerfView creates an .etl.zip file that can be opened and analyzed in PerfView.
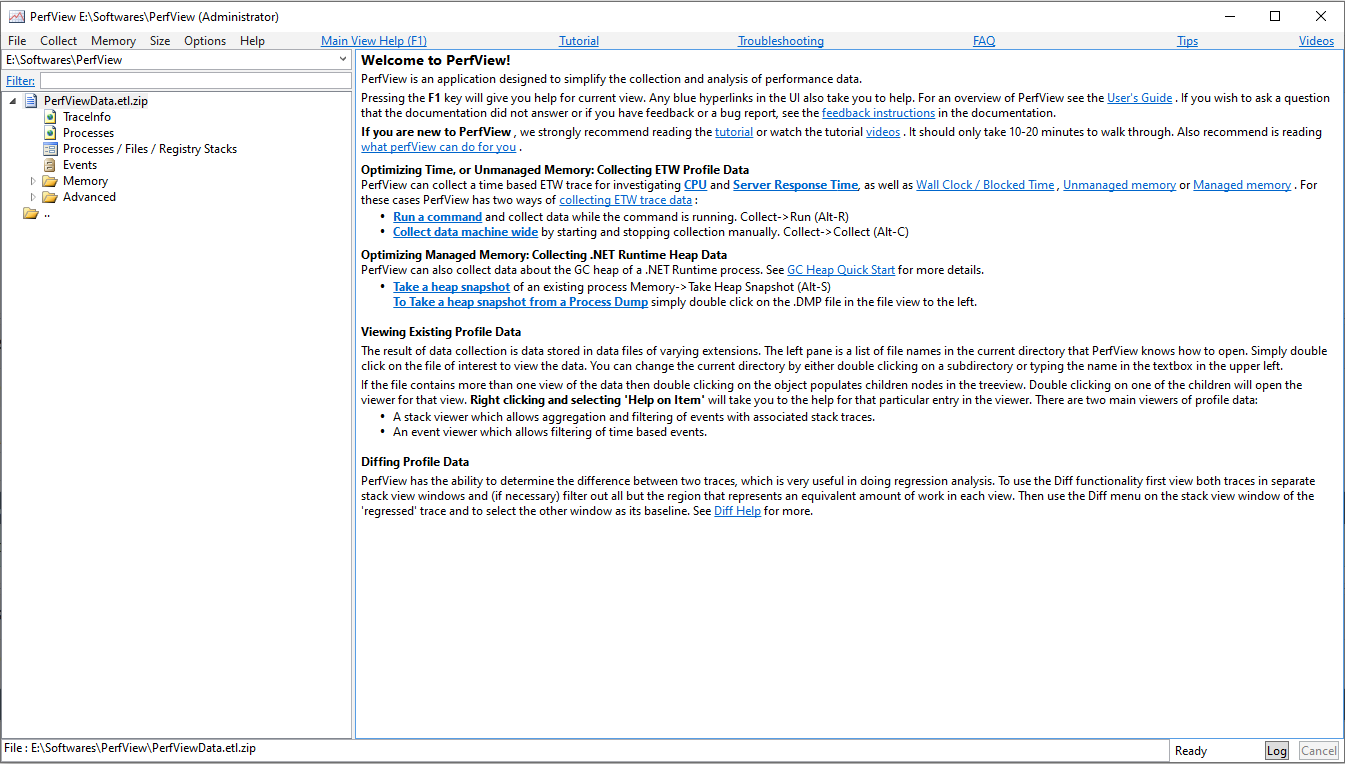
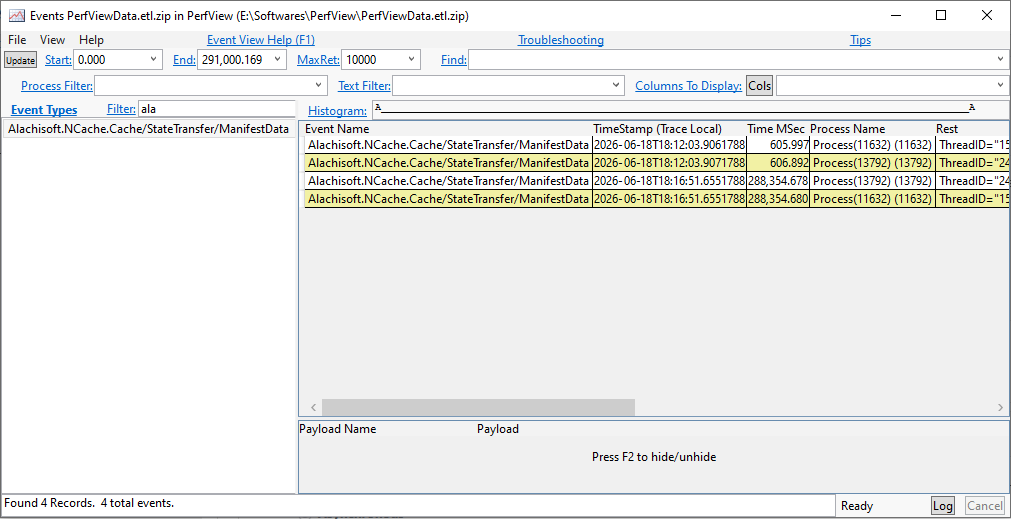
- Open the generated trace file in PerfView, expand the folder, and click Events. You can then filter the results and select a specific event to view, as shown below.
See Also
NCache Counters
Monitor Caches using NCache Management Center
Test-Stress PowerShell Reference
