Azure Monitor
NCache Cloud deploys a pre-configured Azure Monitor dashboard with Grafana inside your managed resource group. This integration provides live metrics for cache performance and displays detailed NCache system logs in a single place.
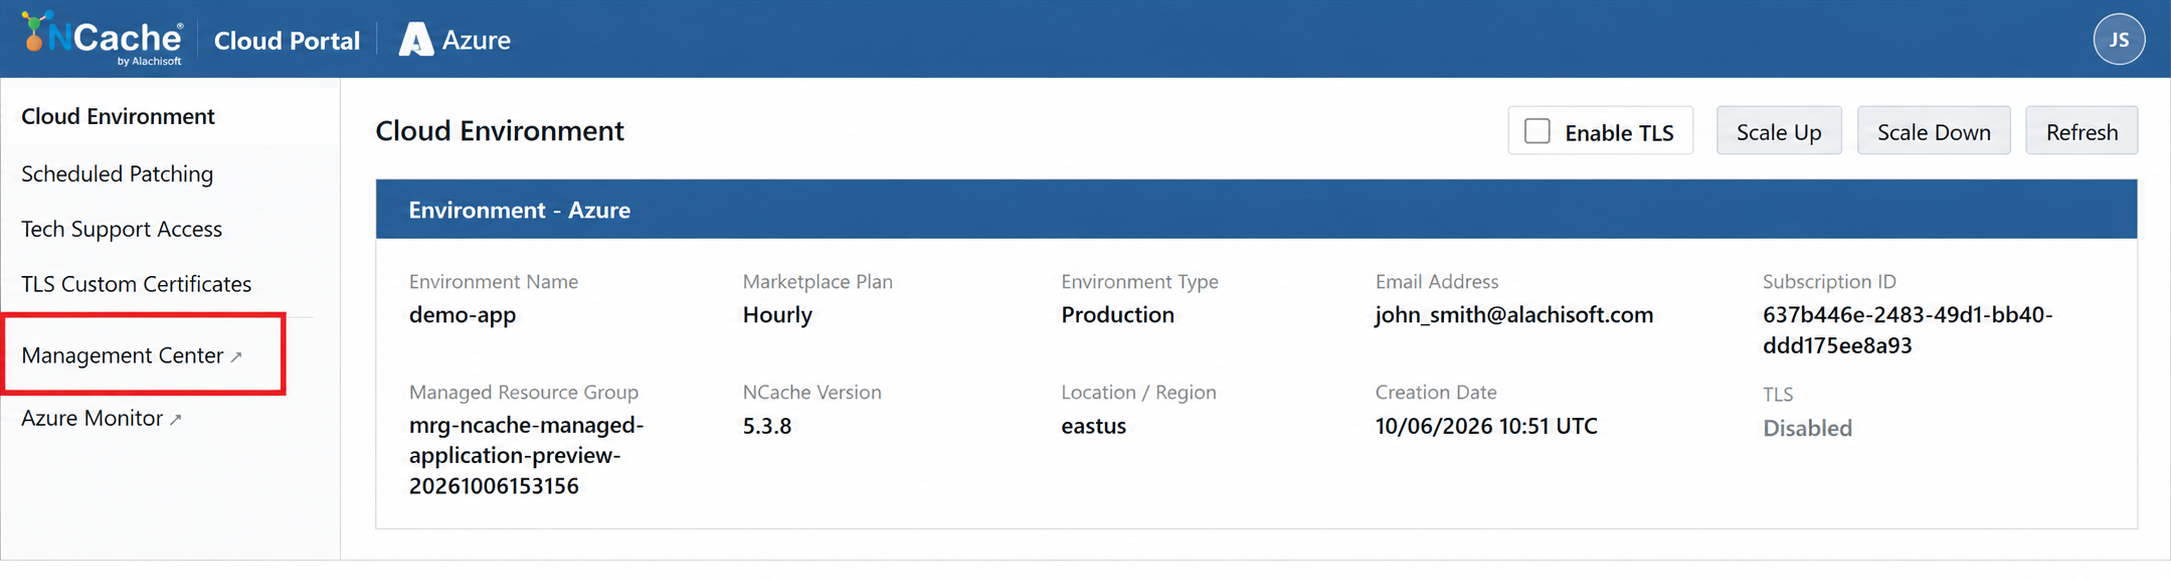
You can either access the dashboard from the Azure Portal or through the Azure Monitor in the NCache Cloud Portal.
Accessing the Dashboard through Azure Portal
In the Azure Portal, open your environment's managed resource group (e.g.,
mrg-ncache-managed-application-...).From the list of resources, locate and open the Azure Monitor dashboards with Grafana resource (e.g.,
demo-app-dashboard).
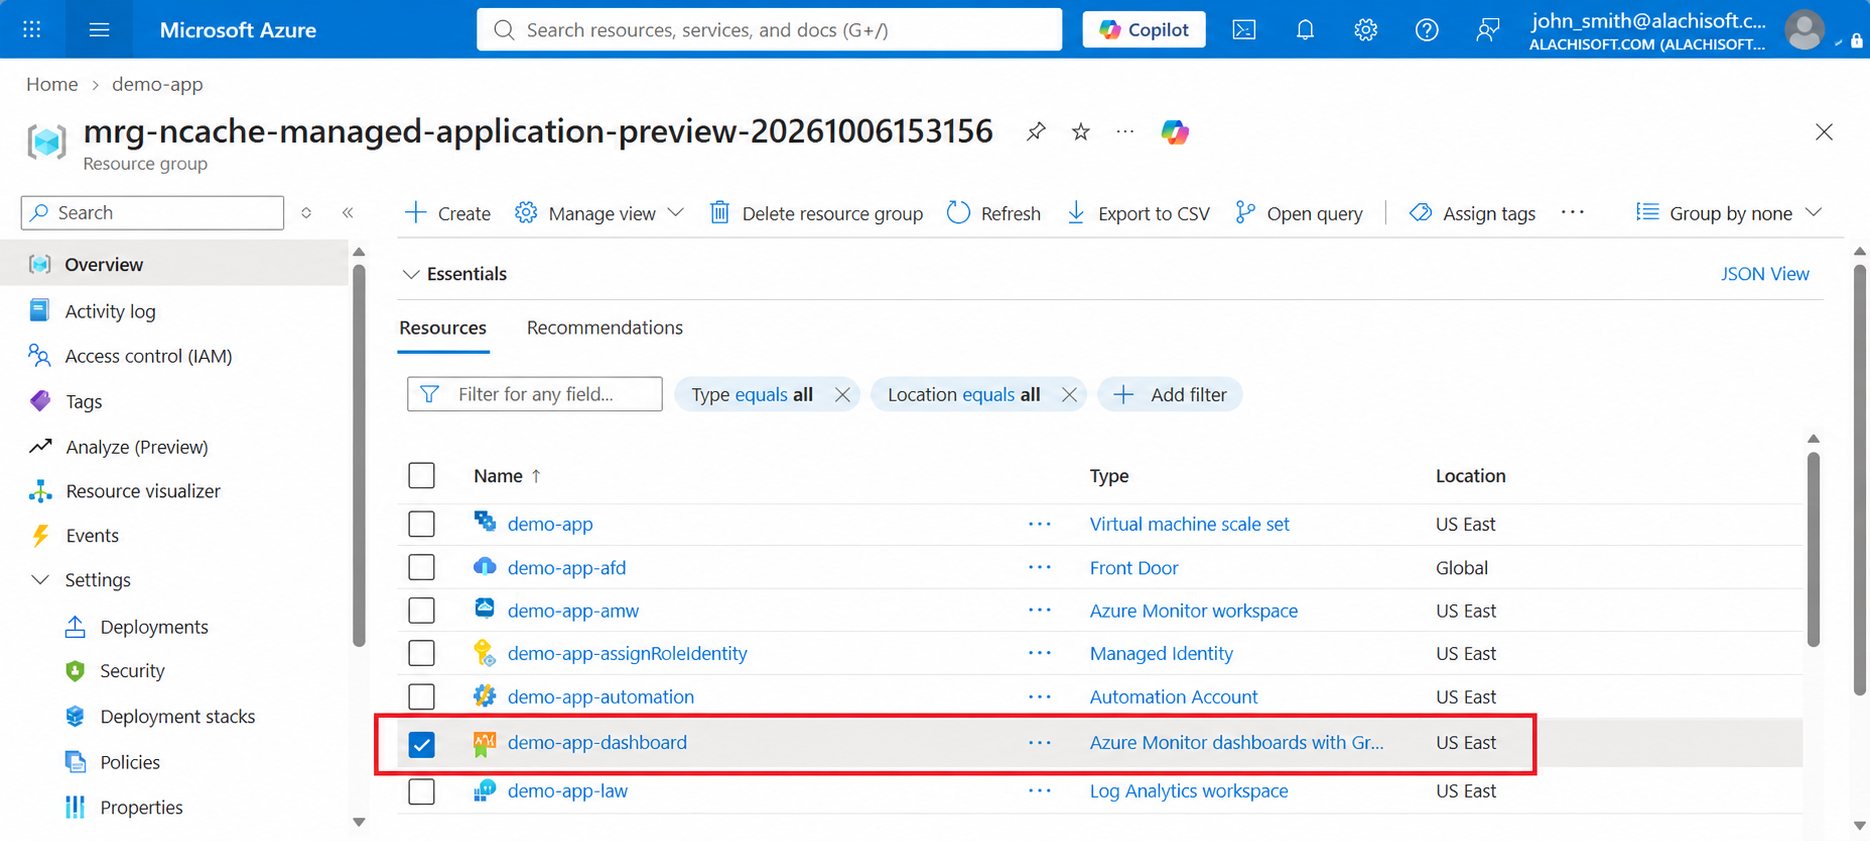
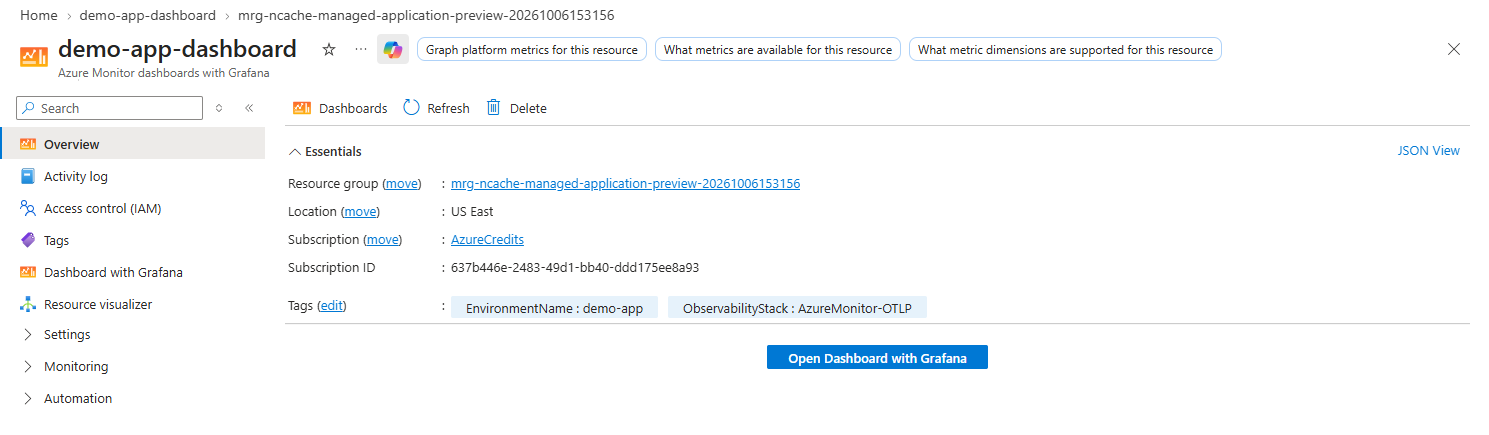
- In the Overview section, click Open Dashboard with Grafana (or select Dashboard with Grafana from the left navigation menu).
Accessing the Dashboard through Azure Monitor
You can also access the Grafana Dashboard from the Azure Monitor in the NCache Cloud Portal.
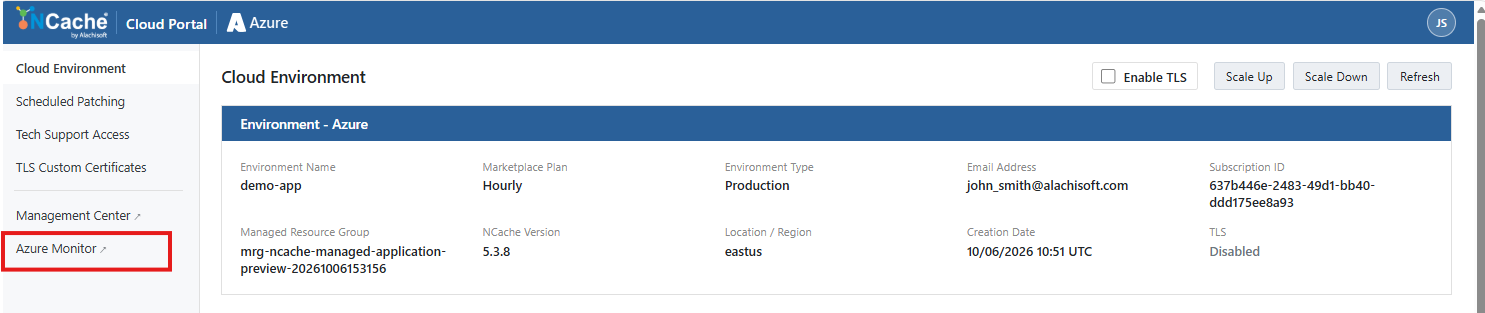
Upon clicking this, you will be redirected to the Azure Portal Overview page.
Click "Open Dashboard with Grafana" to see the metrics. (The same as when accessing the dashboard through Azure Portal.)
Simulating Traffic with Test Stress
If your cluster has just been deployed, the metric panels will show No data because no application is actively reading or writing to the cache:
- Open the NCache Management Center via the NCache Cloud Portal.
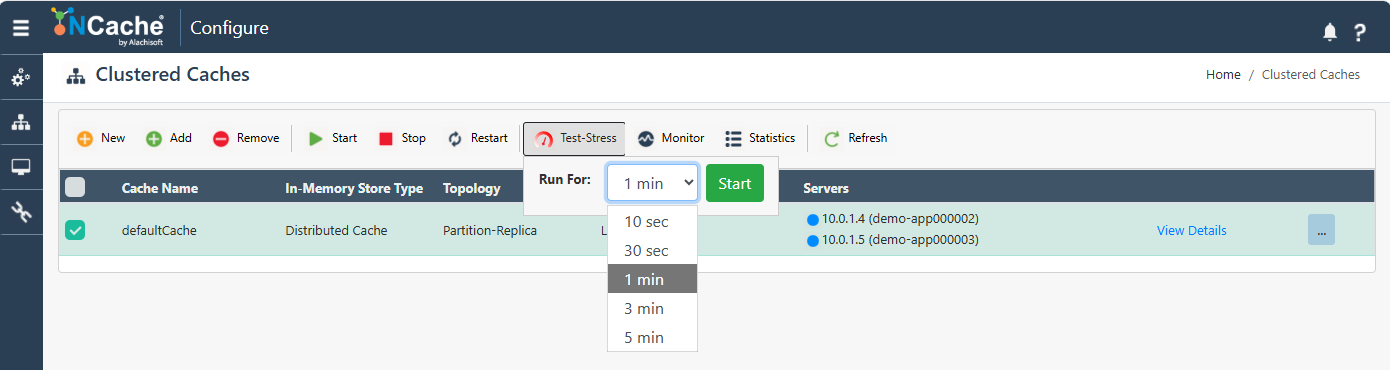
Navigate to Clustered Caches and select your cache (e.g.,
defaultcache).Click the Test Stress button in the toolbar to simulate continuous cache read/write workloads.
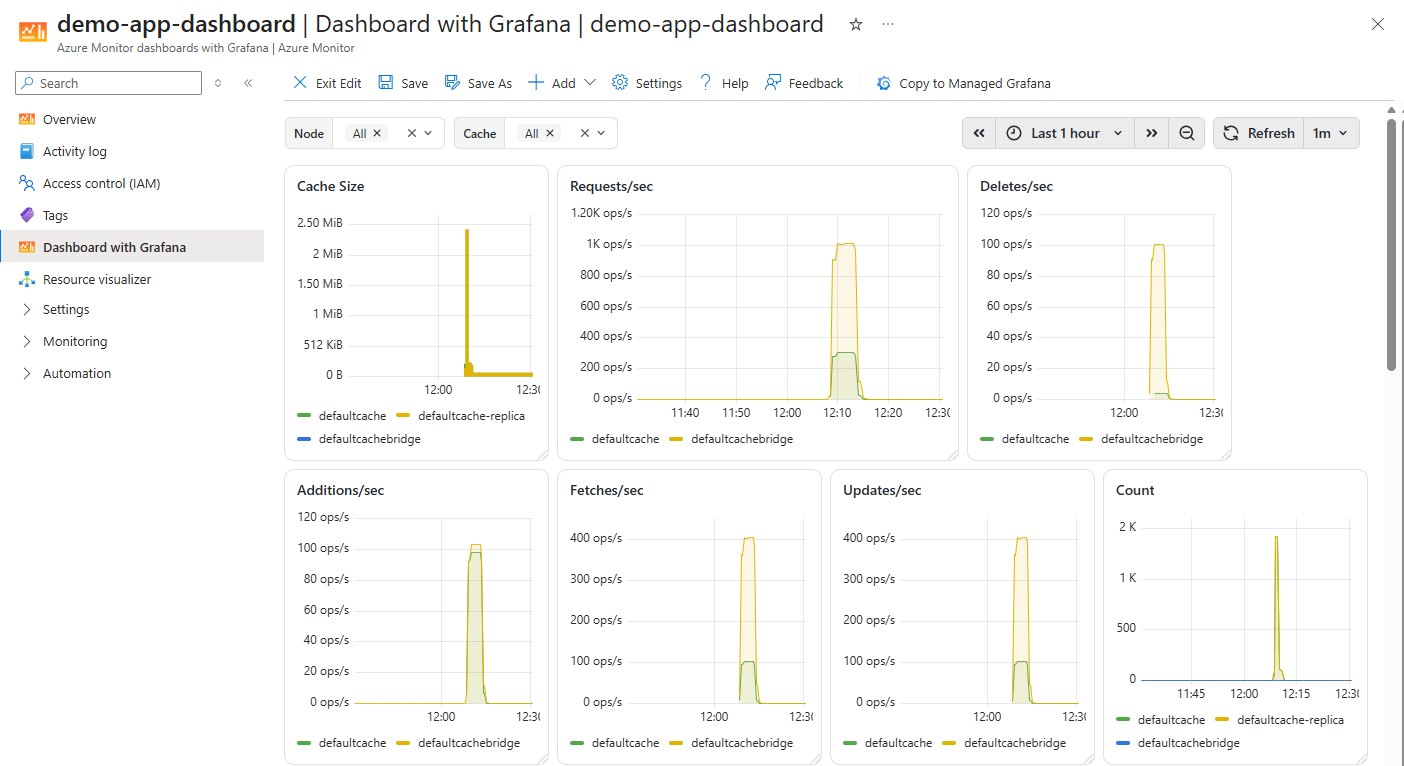
- Return to your Grafana dashboard in the Azure Portal and click Refresh (or wait for the automatic refresh cycle). The graphs will begin populating with live telemetry.
Filtering and Dashboard Controls
The top toolbar allows you to filter and customize your view:
Node: Filter metrics by a specific VMSS instance or select
All.Cache: Choose a specific cache cluster (e.g.,
defaultcache) or monitor all caches simultaneously.Time Range: Select the monitoring timeframe (e.g.,
Last 1 hour).Refresh: Set auto-refresh intervals (e.g.,
1m) to stream updates automatically.
Monitored Metrics
The dashboard visualizes key operational metrics across your NCache cluster:
Activity and Performance
Cache Size: The current memory footprint used by active and replica partitions (e.g.,
defaultcachevs.defaultcache-replica).Requests/sec: Total incoming operations per second across all connected clients.
Average µs/cache operation: Latency per cache request measured in microseconds.
Operations Breakdown: Visual panels tracking individual operations per second, including:
- Additions/sec
- Fetches/sec
- Updates/sec
- Deletes/sec
Capacity and Indices
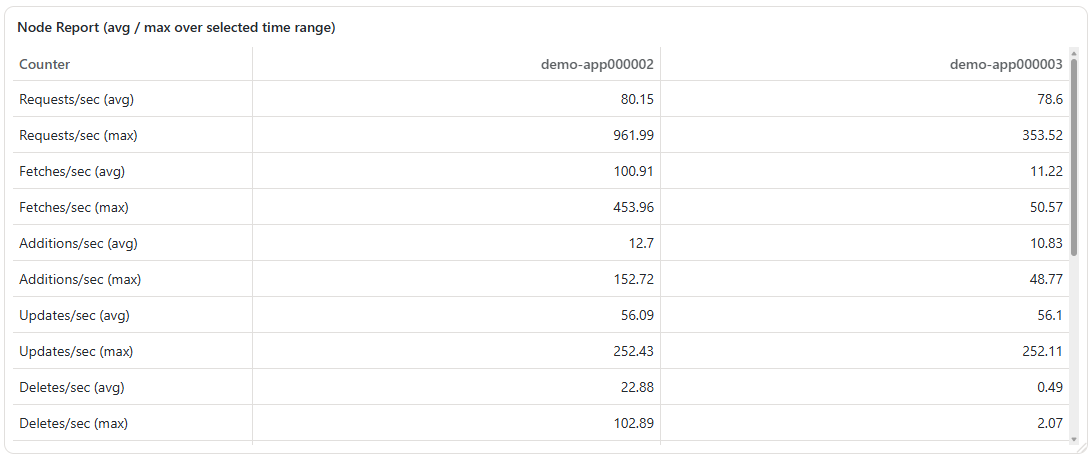
A structured summary table details operational counts and internal memory allocations:
Count (avg / max): Average and peak item counts stored in the cache.
Cache Size (MB) (avg / max): Data size distribution across the cluster.
Query Index Size (MB) (avg / max): Memory reserved for indexing searchable query attributes.
Expiration Index Size (MB) (avg / max): Memory tracking item expiration lifecycles.
Eviction Index Size (MB) (avg / max): Memory allocated for prioritizing least frequently/recently used items during eviction.
NCache Logs
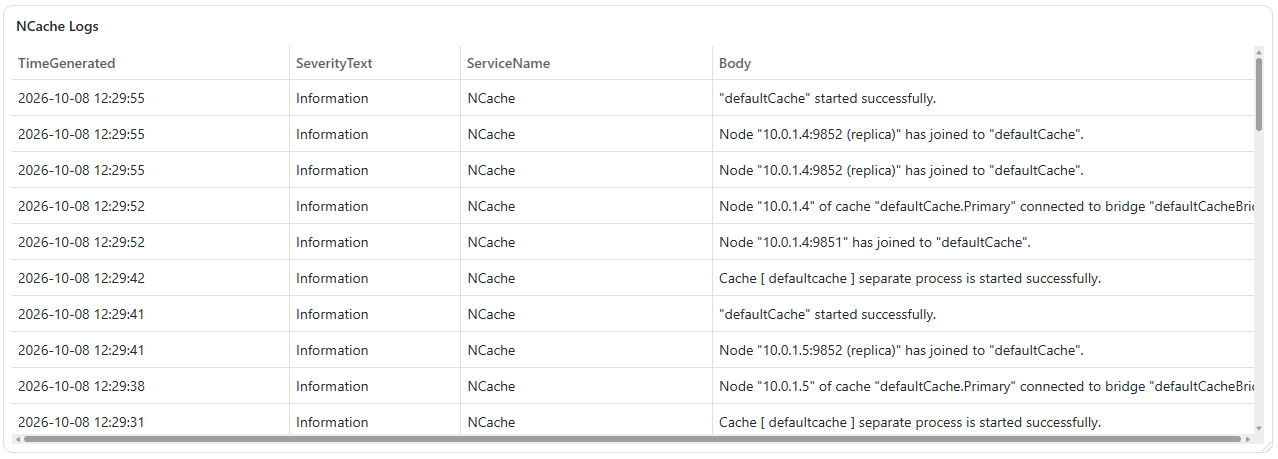
Directly beneath the metric panels, the NCache Logs section aggregates diagnostic and event streams emitted by the NCache services.
Centralized Telemetry: Collects internal logs from every container node running in the scale set via OpenTelemetry (OTLP) and Azure Monitor.
Troubleshooting: If an operation fails, test stress halts, or a node reports errors, inspect this log panel to view timestamps, log severity levels (Error, Warning, Info), and detailed stack traces directly inside Azure.