• Facebook
  • Twitter
  • Youtube
  • LinedIn
  • RSS
  • Docs
  • Comparisons
  • Blogs
  • Download
  • Contact Us
Download
Show / Hide Table of Contents

Configure Counters to Display Caching Statistics

NCache provides a comprehensive set of performance counters that offer real-time visibility into cache activity, resource utilization, and cluster health. These counters help monitor cache performance, analyze throughput, identify bottlenecks, and troubleshoot runtime issues. By default, the Cache Statistics window in NCache Management Center displays a selected set of commonly used counters, such as requests/sec, cache hit ratio, and cache size. However, NCache allows you to customize this view by adding or removing counters based on your monitoring requirements.

By default, a few important counters are displayed in the cache performance statistics window, but you can add/remove more counters according to your requirements. In order to add counters to the statistics window, follow the steps below.

Steps to Configure Counters to Display Caching Statistics

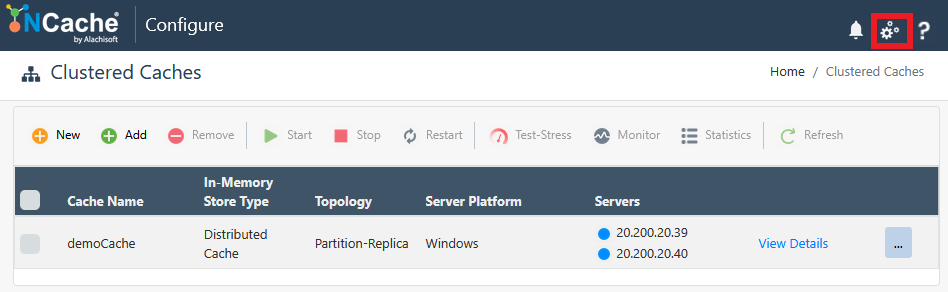
  • Launch the NCache Management Center by browsing to http://localhost:8251 or <server-ip>:8251.

  • Go to the Settings Tab in the rightmost corner of the page.

Expanded Settings menu in NCache Management Center showing configuration options, including Statistics Options for monitoring cache performance.

  • Select Statistics Options from the left menu. Expand one of the tabs based on your cache and select the counters that you want to be displayed from the list. For instance, we've selected the General and Caching categories.

Statistics Options screen in NCache Management Center with General and Caching performance counter categories expanded and individual counters selected for display.

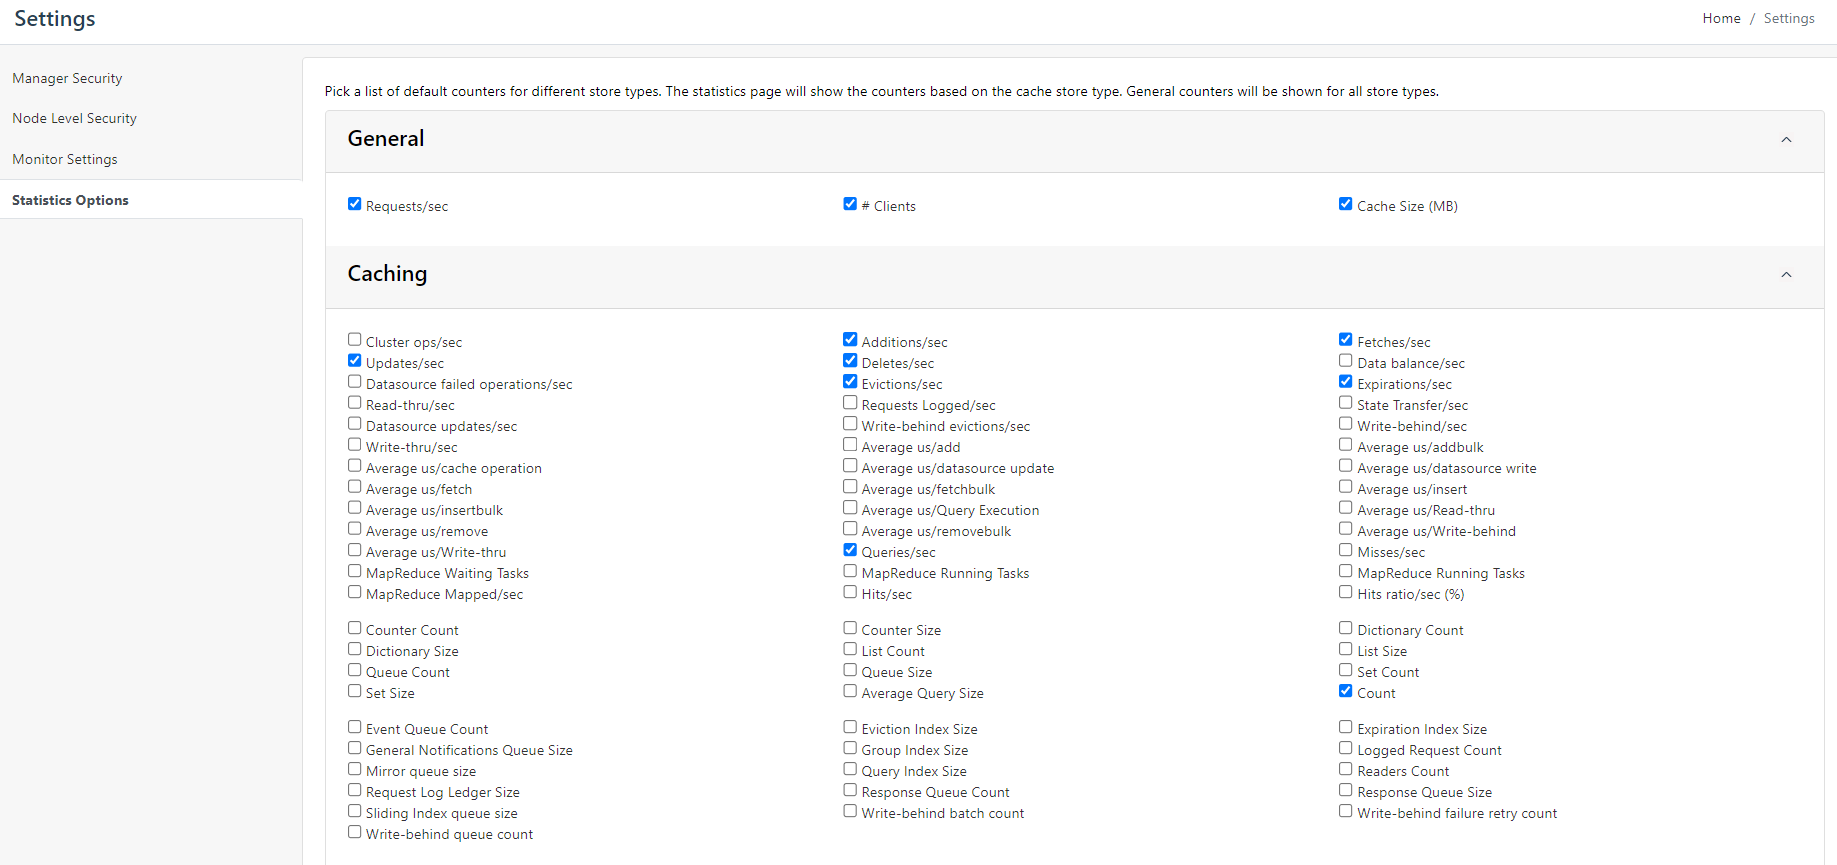
  • Once the counters are selected, please click on the Save button present at the bottom of the settings page.

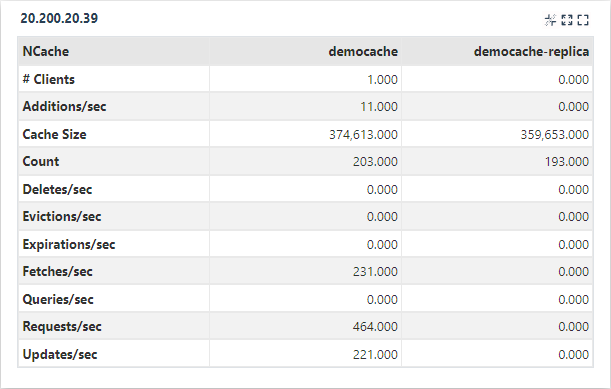
  • On the statistics page, the following tabs (including their relevant counters) will be displayed.

NCache cache statistics page displaying multiple tabs with selected performance counters such as requests per second, cache hits, misses, and cache size.

See Also

Configure API Logging
Browse Cache Statistics
Email Notifications on NCache Events
Monitor NCache Using Windows PerfMon Tool

Contact Us

PHONE

+1 214-619-2601   (US)

+44 20 7993 8327   (UK)

 
EMAIL

sales@alachisoft.com

support@alachisoft.com

NCache
  • Edition Comparison
  • NCache Architecture
  • Benchmarks
Download
Pricing
Try Playground

Deployments
  • Cloud (SaaS & Software)
  • On-Premises
  • Kubernetes
  • Docker
Technical Use Cases
  • ASP.NET Sessions
  • ASP.NET Core Sessions
  • Pub/Sub Messaging
  • Real-Time ASP.NET SignalR
  • Internet of Things (IoT)
  • NoSQL Database
  • Stream Processing
  • Microservices
Resources
  • Magazine Articles
  • Third-Party Articles
  • Articles
  • Videos
  • Whitepapers
  • Shows
  • Talks
  • Blogs
  • Docs
Customer Case Studies
  • Testimonials
  • Customers
Support
  • Schedule a Demo
  • Forum (Google Groups)
  • Tips
Company
  • Leadership
  • Partners
  • News
  • Events
  • Careers
Contact Us

  • EnglishChinese (Simplified)FrenchGermanItalianJapaneseKoreanPortugueseSpanish

  • Contact Us
  •  
  • Sitemap
  •  
  • Terms of Use
  •  
  • Privacy Policy
© Copyright Alachisoft 2002 - . All rights reserved. NCache is a registered trademark of Diyatech Corp.
Back to top