Monitor Bridge - WAN Replication
WAN Replication provides visibility into cross-site data synchronization and cluster health across geographically distributed data centers. Monitoring bridge performance allows the administrator to ensure Disaster Recovery (DR) readiness, track WAN replication latency, and identify network bottlenecks between site clusters. Effective monitoring makes sure that asynchronous data transfer is consistent and that the replication queue does not grow beyond operational limits. You can monitor the performance of your bridge and the caches it encompasses through the NCache Monitor or the Windows Event Viewer as explained in detail below.
Using the NCache Management Center
Prerequisites
Please ensure that the time on your server machine and the machine where the NCache Management Center runs is synchronized with the World Clock Time.
Ensure that the NCache Service starts. If it does not, proceed with the following:
To start the NCache Service on Windows, open Windows PowerShell as Administrator and run the following command:
Start-Service -Name NCacheSvc
Make sure that you run the NCache Service as an administrator. Here are the steps to do so:
- Open the Services window and look for NCache in the list.
- Right click on NCacheSvc from the list and choose Properties.
- Go to the Log On tab and click on the Browse button.
- In the object name field, type Administrator and click on the Check Names button.
- It will pick the appropriate Administrator, then click OK.
- Now, set a Password and click OK.
- Right click on the NCache Service and choose the Restart option. Now your service will start running as administrator.
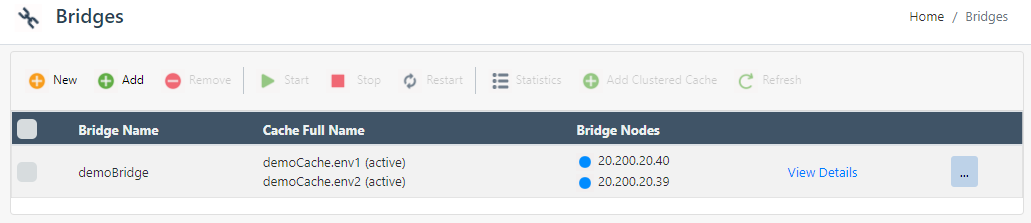
Bridges are used to synchronize caches across the WAN. These can be monitored using the NCache Monitor.
Launch the NCache Management Center by browsing to http://localhost:8251 or
<server-ip>:8251on Windows and Linux.In the left navigation bar, click on Bridges. The page shows any existing bridges and additional details like Cache Name and Bridge Nodes.
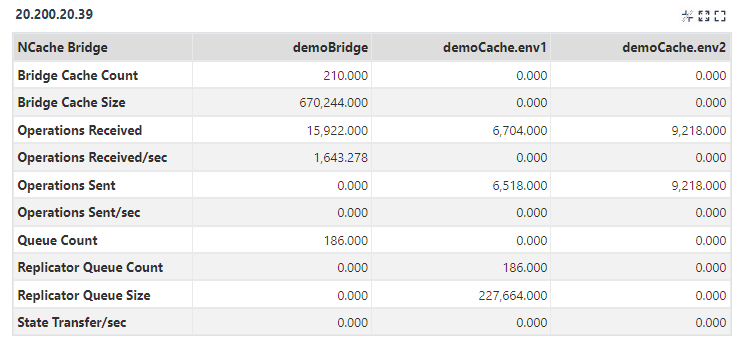
- Click on the "..." button against the bridge name and click on Statistics.

A new statistic window is opened as a result showing the counter view.
Click on Add Counter at the top of the page.
From the category list, select NCache Bridge. It shows you a list of instances.
Select your bridge instance. In the next window, a Select Counters box shows the list of the counters.

- Select the counters and then click on the Add Counters button. It will display the statistic window along with the added counters.
Using Windows Event Viewer
Bridge operations are also logged in the Windows Event Viewer such as a node joining a bridge or a cache connecting to the bridge. This is particularly useful as you can run custom batch scripts on an event in the Windows Event Viewer. So, if you want to perform a specific action like initiating a state transfer once the cache connects to the bridge, you can do so by calling the Start-BridgeStateTransfer PowerShell cmdlet in your script against that event ID.
See Also
Monitor Caches using NCache Monitor
Monitor Cluster Connectivity
Monitor Caches Using the NCache Management Center
Troubleshooting NCache Monitoring