Monitor NCache using Grafana [Deprecated]
NCache provides a Grafana Application Plugin that collects and displays NCache metrics data from your cluster using Prometheus as a data source. These metrics are published by NCache Cluster to Prometheus which are then queried by the Grafana application.
Configure Grafana for NCache Monitoring
Follow these steps to configure the Grafana application to monitor NCache metrics on a feature-rich metrics dashboard:
Note
Grafana currently supports Prometheus 2.3.7.1 (LTS) or above.
Prerequisites
- To use Grafana, you need to configure monitoring of NCache using Prometheus as Grafana collects the metrics published on the Prometheus server. To know how to enable monitoring using Prometheus, refer to Monitor NCache using Prometheus.
- NCache Service must be running.
- The caches you want to monitor should be configured and running.
- Go to the
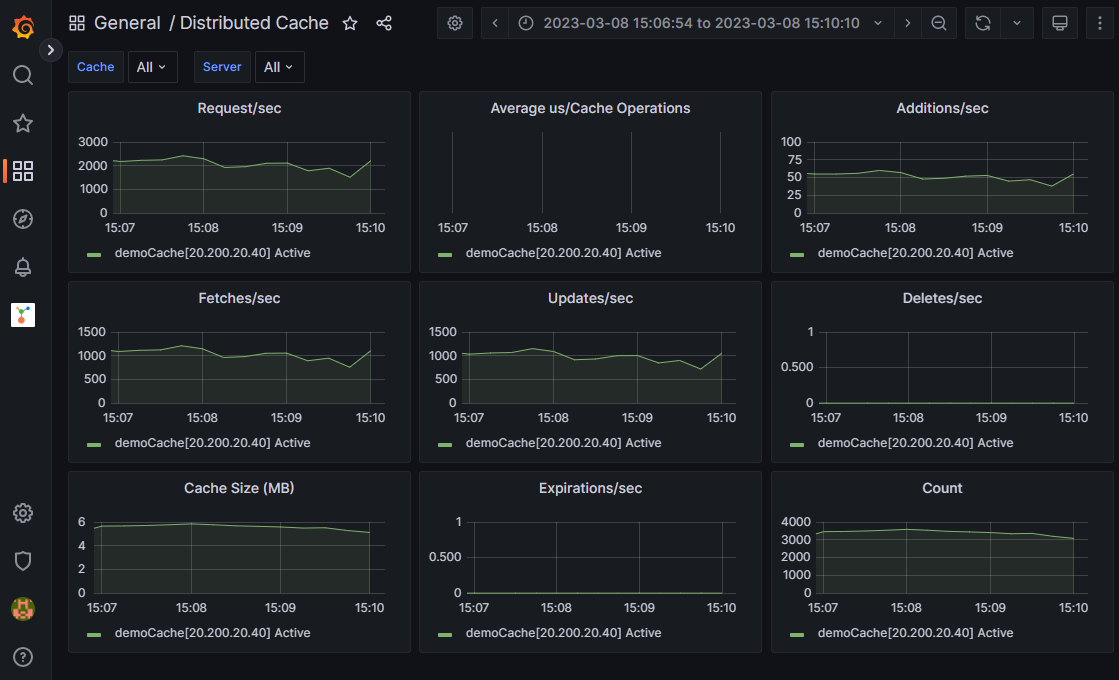
%NCHOME%\config\monitoring.ncconffile in Windows and the/opt/ncache/config/monitoring.ncconffile in Linux and ensure the following counters are set to True based on your requirements.- For Distributed Cache, enable the following counters from the NCache Category
- Request/sec
- Average us/Cache Operations
- Additions/sec
- Fetches/sec
- Updates/sec
- Deletes/sec
- Cache Size (MB)
- NCache CPU Usage
- NCache Memory Usage (MB)
- Count
- Expirations/sec
- Evictions/sec
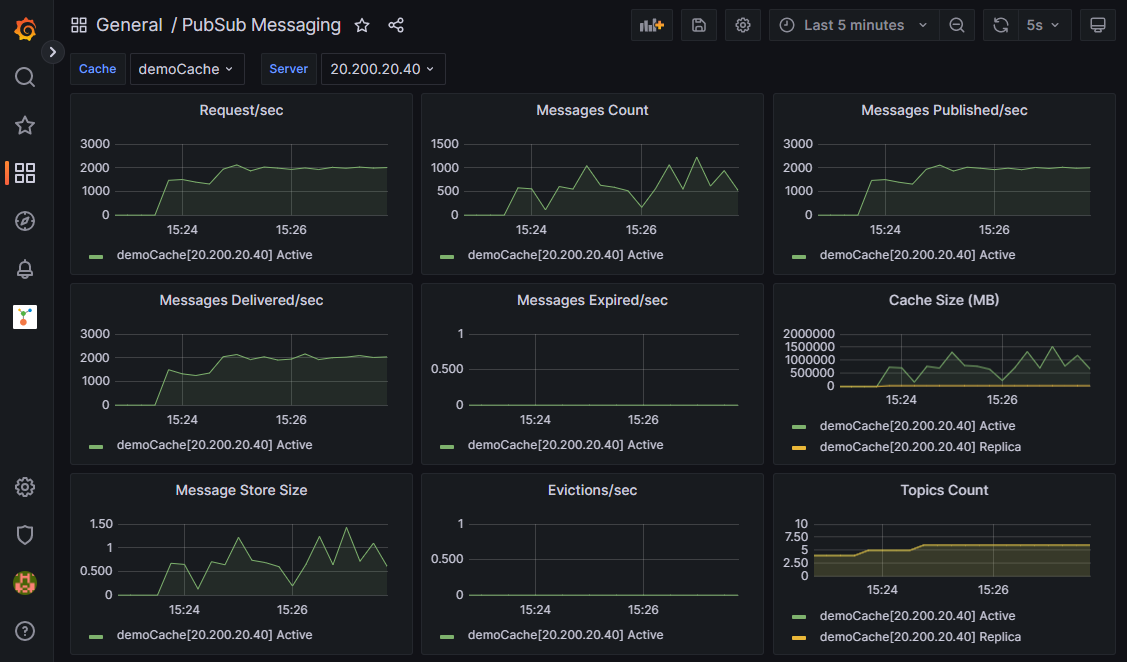
- For Pub/Sub Messaging, enable the following counters from the NCache Category
- Request/sec
- Messages Count
- Messages Published/sec
- Messages Delivered/sec
- Messages Expired/sec
- Cache Size (MB)
- Message Store Size
- NCache CPU Usage
- NCache Memory Usage
- Topics Count
- Evictions/sec
- Average us/Cache Operations
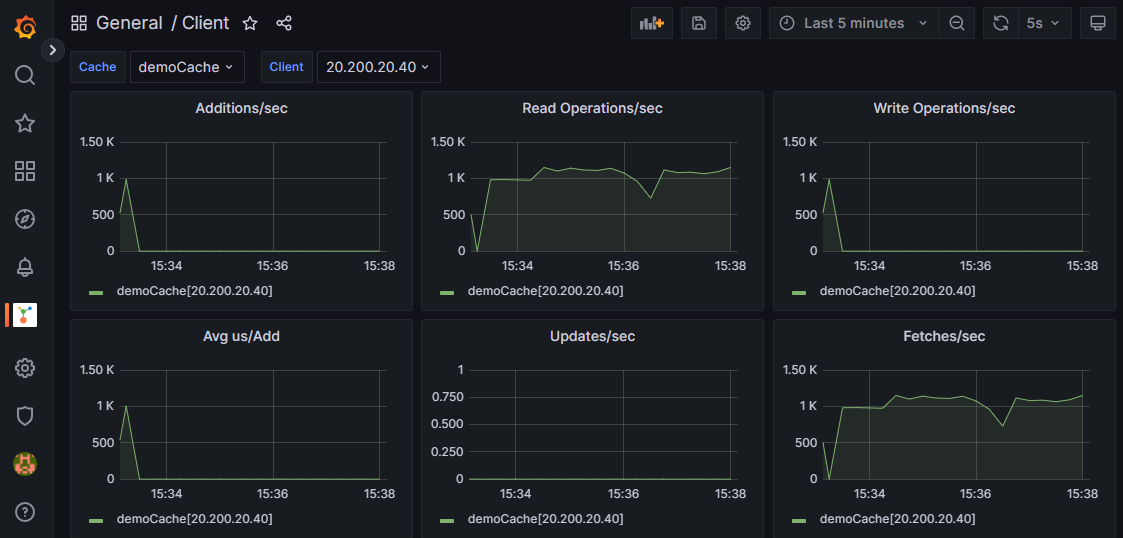
- For the Client, enable the following counters from the NCache Client Category
- Average Item Size
- Read Operations/sec
- Write Operations/sec
- Additions/sec
- Updates/sec
- Fetches/sec
- Avg us/Add
- Avg us/Update
- Avg us/Fetch
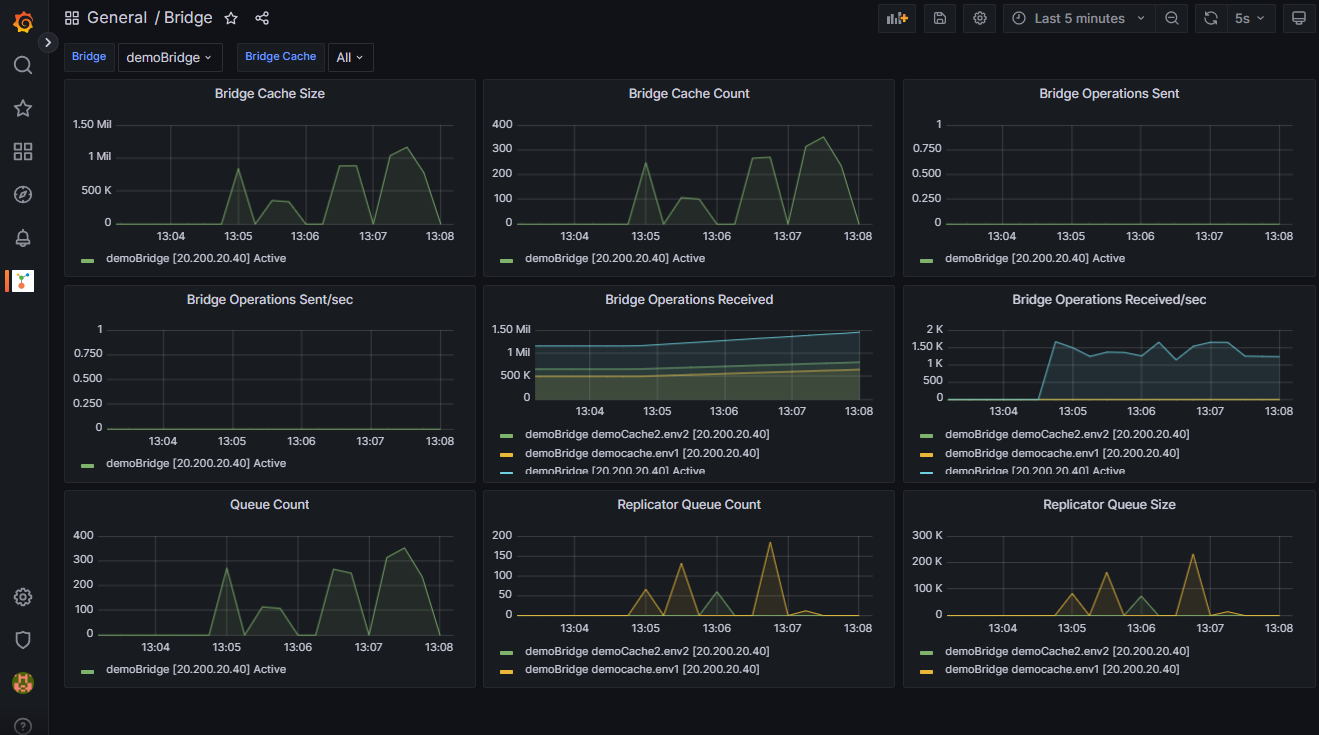
- For Bridge, enable the following counters from the NCache Bridge Category
- Bridge Cache Size
- Bridge Cache Count
- Bridge Operations Sent
- Bridge Operations Sent/sec
- Bridge Operations Received
- Bridge Operations Received/sec
- Queue Count
- Replicator Queue Count
- Replicator Queue Size
- For Distributed Cache, enable the following counters from the NCache Category
Set Up the Grafana Application
Note
Grafana version 9.1.4 and above are supported in this setup.
Install the Grafana application on the machine from where you want to monitor your NCache servers. Refer to Grafana Getting Started guide to find the steps required to set up Grafana on your machine.
Once set up, you need to configure the Prometheus server as Grafana's data source. Follow the add data source guide to add Prometheus as a default data source.
Create a Dashboard for NCache Monitoring
After you have configured your Prometheus server as a data source, you can go ahead and start creating monitoring dashboards. There are two ways through which you can create a dashboard with multiple panels showing NCache counters. You can use an NCache plugin that includes pre-configured dashboards or you can create your custom dashboard and populate it with NCache metrics.
Use the NCache Plugin to Create a Dashboard
NCache provides 6 major dashboard plugins as JSON files:
- Distributed Cache Dashboard for cache server counters.
- Pub/Sub Messaging Dashboard for the Pub/Sub message store counters.
- Client Dashboard for client cache counters.
- Bridge Dashboard for bridge and bridge cache counters.
Follow the steps provided below to configure NCache plugin in your Grafana application:
Download NCache Grafana plugin, unzip the downloaded file, and place the NCache folder (found inside the extracted ncache-grafana folder) on this path
%GRAFANA-INSTALL-DIR%\grafana\plugins-bundled\internal\input-datasource.Go to
%GRAFANA-INSTALL-DIR%\conf\default.inifile, setapp_mode=development.Restart the Grafana service.
Run Grafana (which should open on the default port 3000).
Go to Configuration -> Plugins.
On the search bar, search for NCache.
Click on Enable to add the NCache plugin.
Tip
Go to the Dashboards tab of Plugins/NCache to view all dashboards shipped with this plugin. You can delete/re-import these dashboards from here.
Important
Please ensure that the NCacheSvc and NBridgeSvc services are running using your Windows Task Manager and it is best if you restart them.
Enabling the NCache plugin will preload the following dashboards in your application:
Distributed Cache Dashboard
Pub/Sub Messaging Dashboard
Client Dashboard
Bridge Dashboard
Tip
If your dashboards are not working, try reimporting them as you did during the initial installation.
Create Custom Dashboard
After you have configured your Prometheus server as a data source, you can go ahead and start creating monitoring dashboards.
In order to create a new monitoring dashboard, go to Create -> Dashboard -> Add New Panel.
Under Metrics, select ncache. This will show you the list of all metrics collected from the Prometheus server.
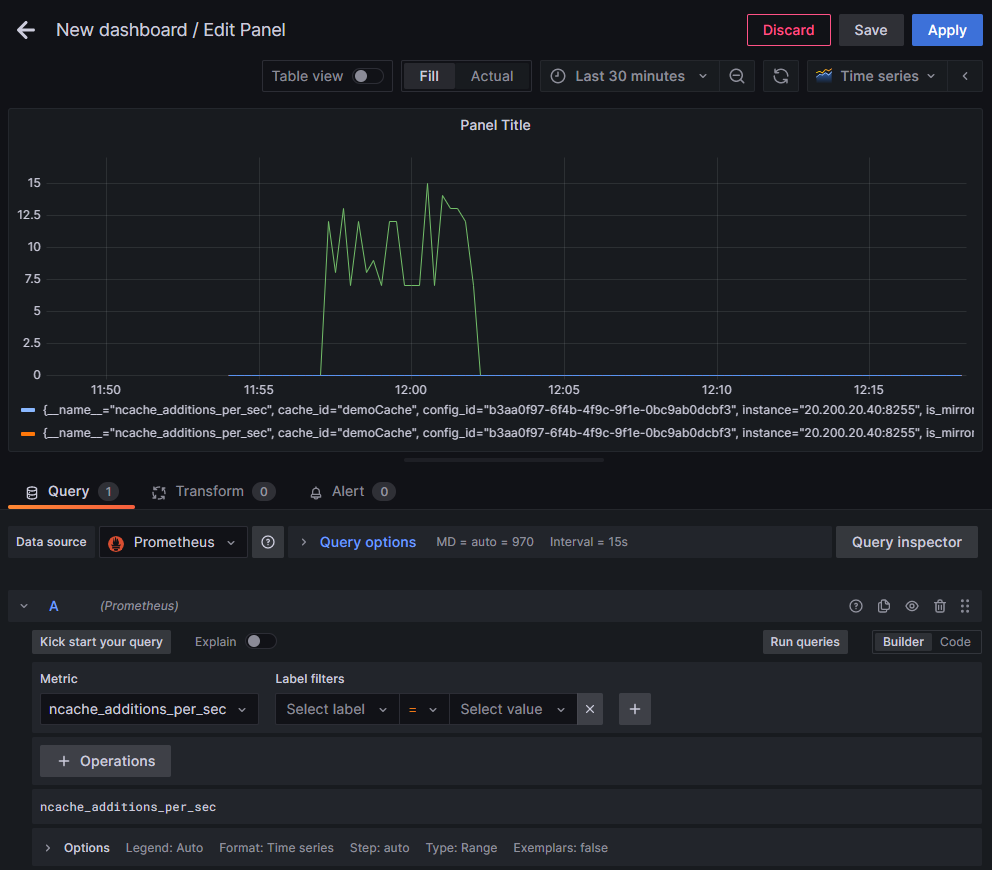
From the list, select the metric you want to monitor in that panel. You can customize this panel as well. Follow Grafana's guide on Dashboards to know how you can play around with this panel.
Click on Apply to apply these configurations to your dashboard.
Save the dashboard by assigning a name to it.
Note
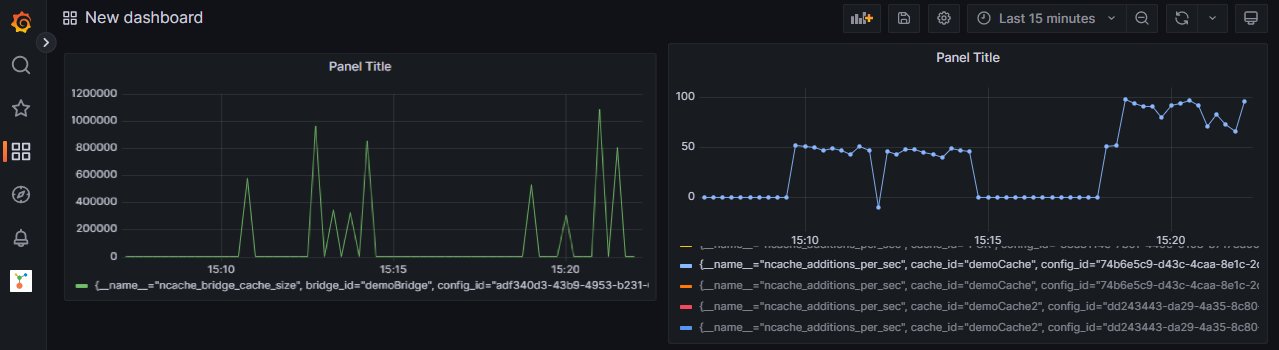
Click on the Add panel ![]() button and follow the same steps to add more monitoring panels to your custom dashboard.
button and follow the same steps to add more monitoring panels to your custom dashboard.
See Also
Monitor NCache using the NCache Monitor
Monitor NCache using PerfMon Tool
Monitor NCache using Prometheus
Monitor NCache using SNMP Counters