• Products
  • Solutions
  • Customers
  • Resources
  • Company
  • Pricing
  • Download
Try Playground
  • Monitor Caches
  • Monitor NCache using Prometheus
Show / Hide Table of Contents
  • Administrator's Guide
  • NCache Architecture
    • Cache Topologies
      • Partitioned Topologies
      • Replicated Topology
      • Mirrored Topology
      • Scalability in Topologies
    • Dynamic Clustering
    • Local Cache
    • Cache Client
    • Client Cache
    • Bridge for WAN Replication
    • Connectivity with Load Balancer
    • Serialization Format
    • Data Encryption
    • Data Compression
    • Data Load Balancing
    • Pipelining
    • Cache Server Backward Compatibility
    • Client Backward Compatibility
    • Eviction
    • Indexing
    • Split-Brain
    • Maintenance Mode
    • Runtime Data Sharing
    • Portable Data Types
    • Class Versioning
    • IP Binding with Multiple NICs
    • Graceful Node Down
    • Separate Cache Host Process
    • Self Healing Dynamic Clustering
    • Distributed Cache with Persistence
  • NCache Management Center
  • Configure Caches
    • Create a Cache
      • Local Cache Overview
        • Local Cache
        • Local Cache with Persistence
        • Pub/Sub Messaging Cache
        • Add Existing Cache
      • Clustered Cache Overview
        • Distributed Cache
        • Persistent Distributed Cache
        • Pub/Sub Messaging Cache
        • Add Existing Clustered Cache
        • Troubleshooting
    • Remove Cache
    • Clear Cache
    • Add Server Node
    • Remove Server Node
    • Add Test Data
    • Configure Query Indexes
    • Configure JSON Query Indexes
    • Compact Serialization
      • Non-Generic Registration
      • Non-Generic Unregistration
      • Generic Registration
      • Using Type Handler
    • Deploy Providers
    • Configure Custom Dependency
    • Add Data Source Providers
      • Read-Through Provider
      • Write-Through Provider
      • Write-Behind Provider
    • Loader and Refresher
    • Configure Maintenance Mode
      • Stop for Maintenance Mode
      • Exit Maintenance Mode
    • Configure LINQPad
      • Configure LinqPad for NCache
      • Querying Data in LinqPad
  • Configure Clients
    • Add Client Node
    • Remove Client Node
  • Configure Client Cache
    • Create Client Cache
    • Create Client Cache with NuGet
    • Enable Client Cache on Client Nodes
    • Disable Client Cache on Client Nodes
    • Remove Client Cache
  • Management Operations
    • Start Cache
    • Stop Cache
    • Restart Cache
    • Manage Cache Service on a Server Node
    • Memory Dumps
    • Data Load Balancing
    • Invoke Refresher Dataset
    • Import/Export Cache Data
    • Suspend/Resume NCache Data Persistence
    • Backup and Restore NCache Persisted Data
  • Cache Settings
    • General Cache Settings
      • Cache Size
      • Cache Isolation Levels
      • Cache Serialization Format
      • Cache Data Expiration
    • Cache Cluster Settings
      • Ports
      • Operation Timeout
      • Configure Pipelining
      • Static Replication Interval
      • Connection Retries
      • Retry Interval
      • Split-Brain Auto Recovery
    • NCache Persistence Settings
      • Store Information
      • Persistence Interval
    • Error Logging
    • Cache Level Events
    • Client Activity Events
    • Eviction Policy
    • MapReduce
    • Register Classes for Portable Data Sharing
    • Compression
    • Email Notifications
    • Bind IP with Multiple NICs
      • Bind Cluster with a Dedicated IP
      • Bind Client/Server with a Dedicated IP
    • Heartbeat
    • Keep Alive
    • Client Death Detection
    • Communication Reliability
    • Auto Start Cache on Boot
    • Nagle's Algorithm
    • Dual Socket
    • Configuration Files
      • Client Side Configurations
        • Client Config
        • EFCaching Config
      • Server Side Configurations
        • Cache Config
        • Bridge Config
        • Modules Config
        • Security Config
        • TLS Config
        • Monitoring Config
        • Emails Template
  • Cache Server Settings
    • Server Connectivity
    • Bind to Multiple NICs
    • Server Ports
    • Memory
    • Custom Dependency
    • Request Inquiry
    • Windows Events
    • Message Events
    • Expiration & Eviction
    • SQL Server
    • Logging
    • Monitoring
    • Persistence Data Loading Retries
    • Miscellaneous Configurations
  • Bridge Server Settings
  • Cache Client Settings
  • Client Cache Settings
  • Configure Security
    • Configure Authentication and Authorization
    • Configure Encryption for Cache
    • Configure TLS Encryption
    • Configure HTTPS for NCache Management Center
  • Configure Bridge for WAN Replication
    • Create Bridge
    • Add Clustered Caches to Bridge
    • Configure Bridge Settings
    • Change Cache Synchronization Modes
    • Bridge Management
    • Synchronize Caches in Bridge
    • Leave Bridge
    • Remove Cache from Bridge
    • Configure Conflict Resolver
  • Setup Database for Cache Synchronization
    • Setup SQL Server Environment
    • Setup Oracle Database Environment
    • Setup OleDb Environment
    • Setup SQL Server for CLR Procedures
  • Simulate NCache Usage
  • Monitor Caches
    • Counters
      • Distributed Cache Counters
      • Distributed Cache with Persistence Counters
      • Pub/Sub Messaging Cache Counters
      • Cache Client Counters
      • Bridge Counters
    • Monitor NCache using the NCache Management Center
      • Using Tabular Statistics
        • Configure Counters to Display Caching Statistics
        • Configure Counters to Display Pub/Sub Statistics
        • Configure Counters to Display Bridge Statistics
        • Browse Cache Statistics
        • Monitor Bridge
      • Using Monitoring Dashboards
        • Configure Monitor Settings
        • Configure Event Logging
        • Configure API Logging
        • Monitor with a Built-In NCache Monitor Dashboard
        • Monitor with the NCache Monitor Custom Dashboard
        • Monitor Cluster Connectivity
        • Monitor Cache Clusters using NCache Email Alerts
    • Monitor Cache Using Command Line Tools
      • Monitor Cache Server Statistics with Command Line Tools
      • Monitor Cache Client Statistics with Command Line Tools
    • Monitor NCache Using Windows PerfMon Tool
      • Monitoring Cache Server Counters using PerfMon
      • Monitoring Cache Client Counters using PerfMon
      • Monitor Bridge Counters Using PerfMon Tool
    • Monitor NCache using Prometheus
    • Monitor NCache using Grafana
    • Monitor NCache Using SNMP Counters
    • Monitor NCache Using JMX Counters
    • Logging
      • NCache Log Viewer
      • Performance Counters Logging
      • Windows Event Logging
      • Cache Health Alerts
      • Email Notifications on NCache Events
      • Cache Server Logging
      • Client Side API Logging
      • Cache Event IDs
      • Feature Usage Logging
    • Troubleshooting NCache Monitoring
      • Computer Name Not Found
      • Diskperf Not Installed
      • No READ Access to Perflib Subkeys
      • Unable to Connect to Remote Server
    • IPV6 Support

Monitor NCache Using Prometheus [Deprecated]

NCache offers multiple ways to monitor your cache clusters. You can monitor Distributed Caches, Distributed Cache with Persistence, the Pub/Sub Message Store, Clients, and Bridges through the extensive counters published by NCache. These counters allow you to monitor individual cache status and other statistics of your cache on a single platform.

Prometheus is an open-source tool that allows you to monitor your systems. It records real-time metrics in a time series database built using a HTTPS pull model, with flexible queries and real-time alerting. NCache provides support for monitoring its Performance Counters through Prometheus.

Note

This feature is only available in NCache Enterprise

Enable Prometheus Monitoring

To configure monitoring using Prometheus, follow these steps:

Step 1: Configure NCache Service Config

The Alachisoft.NCache.Service.exe.config (.NET Framework)/Alachisoft.NCache.Service.dll.config (.NET) config file shipped at %NCHOME%\bin\service allows you to enable/disable monitoring of your caches on Prometheus through configurable tags. These tags are:

Important

You must reflect your changes across all the NCache service config files of NCache servers and clients.

<add key="NCacheServer.EnableMetricsPublishing" value="true"/>
<add key="NCacheServer.EnablePrometheusMonitoring" value="true"/>
  • Set NCacheServer.EnableMetricsPublishing tag as True: The NCacheServer.EnableMetricsPublishing tag enables metrics publishing to NCache service. This tag is False by default.

  • Set NCacheServer.EnablePrometheusMonitoring tag as True: The NCacheServer.EnablePrometheusMonitoring tag enables monitoring stats on the Prometheus agent. This tag is False by default.

  • Save Changes: Save the config file and restart the NCache service and NCache Bridge service, cache host process, and client application(s) on all client and server machines for the changes to take effect.

Additional Configuration

You can also make the following additional configurations in the NCache service configuration file:

<add key="NCacheServer.MetricServerPort" value="8255"/>
<add key="NCacheServer.EnableSystemCountersMonitoring" value="true"/>
  • The NCacheServer.MetricsServerPort tag configures the port where the prometheus-agent runs. By default, the port is 8255 but you can configure it as per your need.
Important

If you decide to change the NCacheServer.MetricServerPort in the NCache Service config file, you'll also need to reflect this change in the Prometheus.yml file as well.

  • Set NCacheServer.EnableSystemCountersMonitoring tag as True: The NCacheServer.EnableSystemCountersMonitoring tag enables or disables the monitoring of system counters. This tag is set to False by default.
Note

To monitor NCache client performance counters through Prometheus, NCache must be installed on your client machines.

  • Save the config file and restart the NCache Service (NCacheSvc and NBridgeSvc, as well, if that is the dashboard you are interested in) using the Task Manager.

Step 2: Configure Prometheus Config File

The second step of monitoring NCache counters using Prometheus is to configure the prometheus.yml file that is shipped with the Prometheus server.

  • Download and extract Prometheus on your machine.
Note

You can install Prometheus on a separate machine, the client machine, or the NCache server and only a single Prometheus server is enough to monitor all your environments.

  • Open the prometheus.yml file in an editor.

  • Set the scrape_interval per your requirement. This interval is the time after which the Prometheus server pulls metrics from the Prometheus agent. The default value of this tag is 15 seconds.

  • Set the job_name to a value containing the keyword "ncache-metrics" to distinguish multiple targets.

  • Set your agent's address as the targets value. The port should be the same as the one mentioned in the Alachisoft.NCache.Service.dll.config file. Your changes will look like this:

scrape_configs:
  - job_name: 'ncache-metrics'
    static_configs:
    - targets: ['20.200.20.39:8255','20.200.20.40:8255']
  • Save the yml file.

Step 3: Run the Prometheus Application for Cache Monitoring

Important

Update the prometheus.yml file before running the server. In case the Prometheus server was already running when you updated the yml file, you need to restart the Prometheus server. Any change in the prometheus.yml file requires you to restart the Prometheus server.

  • Go to the folder where you extracted the Prometheus setup and run prometheus.exe. If you see the "Server is ready to receive web requests." message on the command prompt, it means your Prometheus server is ready to make calls to your Prometheus agent.

  • Open a web browser of your choice and add the IP of the node where you want the Prometheus server to run along with the default Prometheus server port, i.e., 9090 in the address bar of the browser. For example, if I want the Prometheus server to run on IP 20.200.20.39, I would request for 20.200.20.39:9090 in the address bar.

  • This will open the Prometheus server on your machine.

Prometheus Server Dashboard

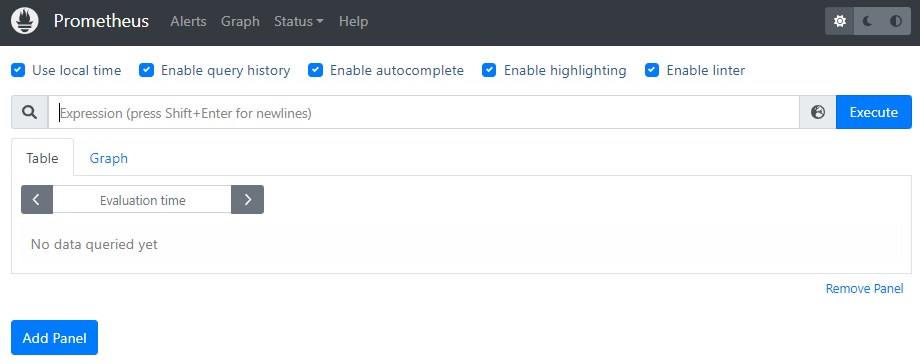
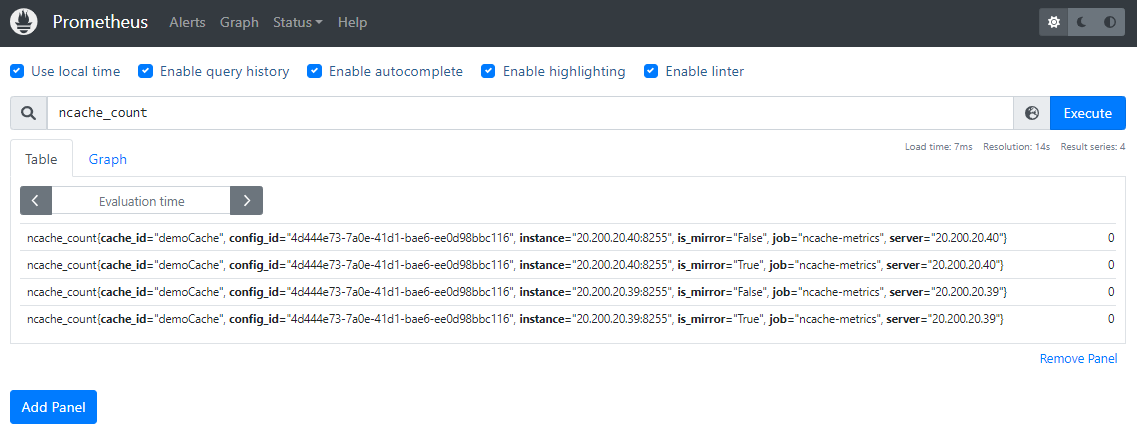
  • In the search bar, search for the counter you want to monitor. This will fetch all instances of that counter from all targets specified in the config file. Go to NCache Counters to see all server, client, Bridge, and Bridge cache counters supported in NCache.

NCache Counters Monitor Prometheus Server

Note

If the counter you want to monitor is not listed among the counters shown on Prometheus, it is most likely that its publishing has been turned off by default. To enable publishing of the counters that you want to monitor, you can use the monitoring.ncconf file shipped with NCache at %NCHOME%\config\ for Windows and /opt/ncache/config for Linux. Refer to Monitoring Config to understand how to configure this file according to your requirements. Please note that only the counters whose publishing has been set to true will be published on the Prometheus agent and server. After this configuration, restart the Caches, Client, and Bridges otherwise your changes won't be reflected.

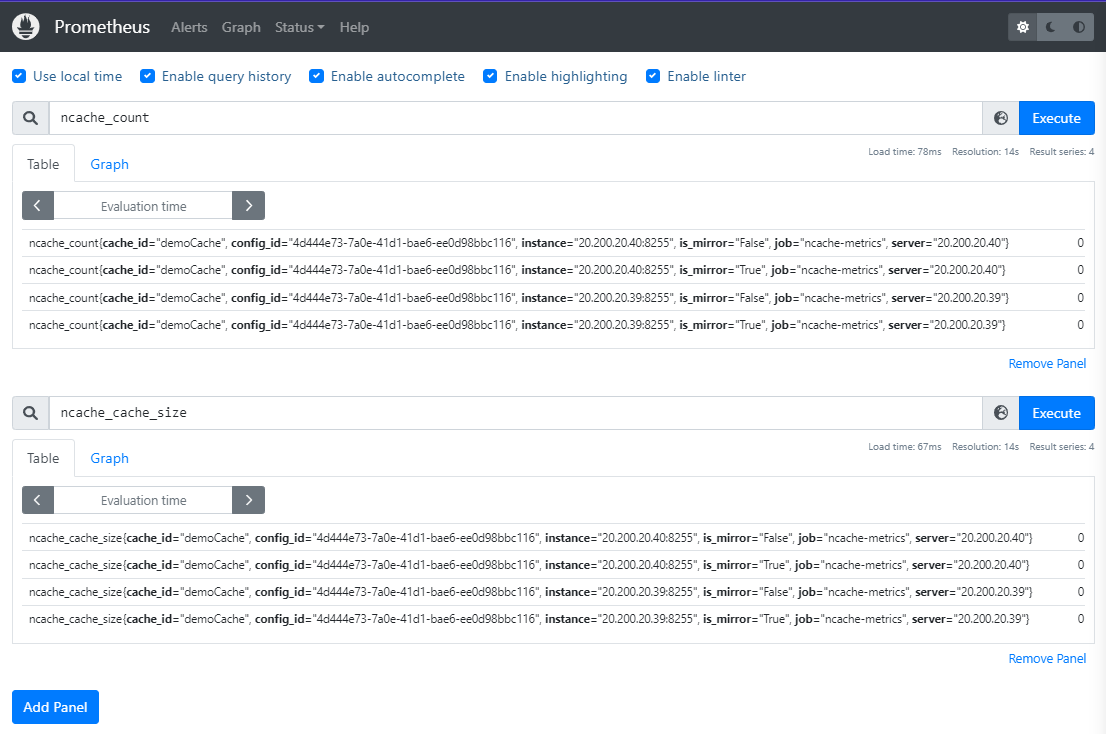
  • You can add panels to view multiple counters at the same time as follows:

Multiple NCache Counters Monitor Prometheus Server

Troubleshooting

In case you encounter any issue with the Prometheus agent, go to MetricServer logs found at %NCHOME%\log-files.

See Also

Monitor NCache using Windows PerfMon Tool
Monitor Caches using the NCache Management Center
Monitor Caches using the NCache Monitor
Logging

In This Article
  • Enable Prometheus Monitoring
    • Step 1: Configure NCache Service Config
    • Step 2: Configure Prometheus Config File
    • Step 3: Run the Prometheus Application for Cache Monitoring
  • Troubleshooting
  • See Also

Contact Us

PHONE

+1 (214) 764-6933   (US)

+44 20 7993 8327   (UK)

 
EMAIL

sales@alachisoft.com

support@alachisoft.com

NCache
  • NCache Enterprise
  • NCache Professional
  • Edition Comparison
  • NCache Architecture
  • Benchmarks
Download
Pricing
Try Playground

Deployments
  • Cloud (SaaS & Software)
  • On-Premises
  • Kubernetes
  • Docker
Technical Use Cases
  • ASP.NET Sessions
  • ASP.NET Core Sessions
  • Pub/Sub Messaging
  • Real-Time ASP.NET SignalR
  • Internet of Things (IoT)
  • NoSQL Database
  • Stream Processing
  • Microservices
Resources
  • Magazine Articles
  • Third-Party Articles
  • Articles
  • Videos
  • Whitepapers
  • Shows
  • Talks
  • Blogs
  • Docs
Customer Case Studies
  • Testimonials
  • Customers
Support
  • Schedule a Demo
  • Forum (Google Groups)
  • Tips
Company
  • Leadership
  • Partners
  • News
  • Events
  • Careers
Contact Us

  • EnglishChinese (Simplified)FrenchGermanItalianJapaneseKoreanPortugueseSpanish

  • Contact Us
  •  
  • Sitemap
  •  
  • Terms of Use
  •  
  • Privacy Policy
© Copyright Alachisoft 2002 - 2025. All rights reserved. NCache is a registered trademark of Diyatech Corp.
Back to top