Performance Counters Logging
Performance Counters Logging in NCache allows administrators to capture real-time performance metrics into binary log files (.blg) for historical analysis and troubleshooting. By converting live dashboard statistics into persistent logs, you can monitor NCache cluster health, identify performance bottlenecks, and schedule automated logging intervals for both individual nodes and entire clustered caches. You can start the performance counters logging instantly, or you can schedule the logging at a specific time. On saving the logs of the cache, a separate log file will be generated for each node in case of a clustered cache.
How to Configure Performance Counters Logging via NCache Management Center
Follow the steps below to log the counters using the NCache Monitor:
Launch the NCache Management Center by browsing to http://localhost:8251 or
<server-ip>:8251.It opens a page showing a list of clustered caches.
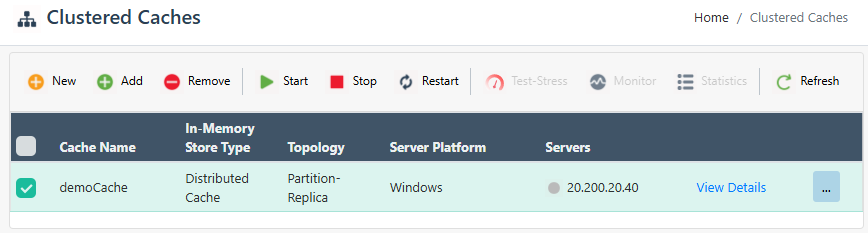
From the top right of the details page, select the
 button. It will open a new page.
From the left menu, select the Monitor Settings. On the opened page, go to the Perfmon Logs section and provide the path for the logs to be saved. If the path is not changed, the default path will be used for saving the logs so please ignore this step.
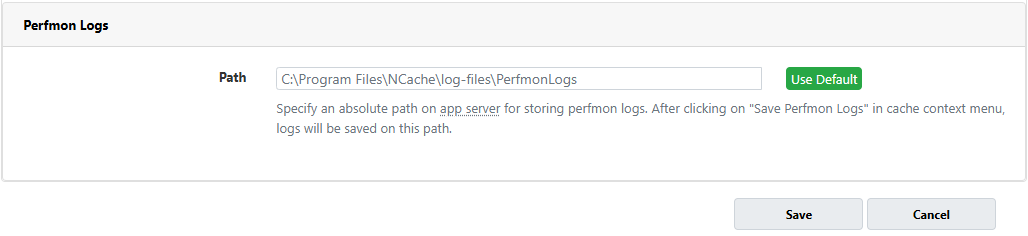
Click Save to save your settings.
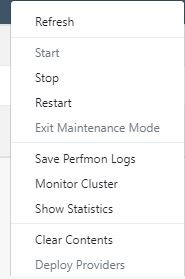
After changing the path, go against the cache name, click on the '...' button, and click on Save PerfMon Logs.
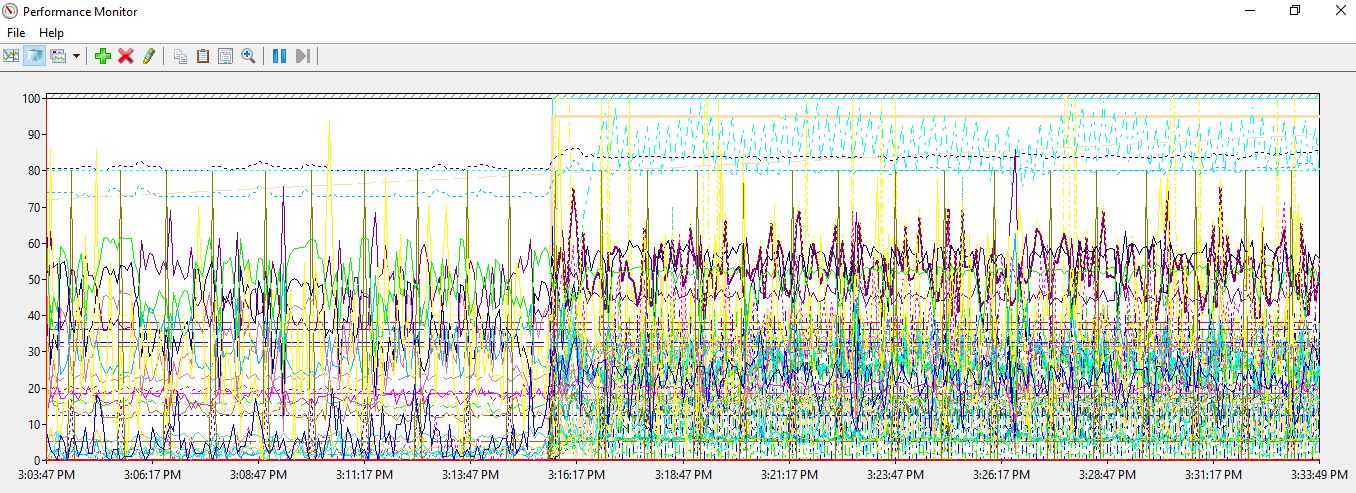
- On the path provided, a new file will be saved with all the PerfMon logs saved in it. On opening this file, Performance Monitor will show the logs saved in the file. You can modify the view and also check the current activity details using this file.