Test Cluster Through Stress
NCache provides the Test-Stress tool to simulate heavy transactional workloads against a running cache. Use it to evaluate cache performance, scalability, latency, and throughput under load. You can run Test-Stress through the NCache Management Center or through PowerShell. It adds and expires test data, allowing real-time monitoring of key metrics like Additions/sec, Fetches/sec, Gets/sec, and expirations through NCache Monitor, Statistics view, or PerfMon.
Note
You can simulate the usage of different store types and monitor Cache Counters for your cache by following the same steps listed below.
Note
Test-Stress behavior varies by in-memory store type:
- Distributed Cache: Normal cache data is inserted and fetched from the cache.
- Pub/Sub Messaging Cache: Topics, publishers, and subscribers are created, along with message data.
Using the NCache Management Center
Follow the steps mentioned below to simulate your cache usage under stress through the NCache Management Center:
Launch the NCache Management Center by browsing to http://localhost:8251 or
<server-ip>:8251.From the left navigation bar, click on Clustered Caches.
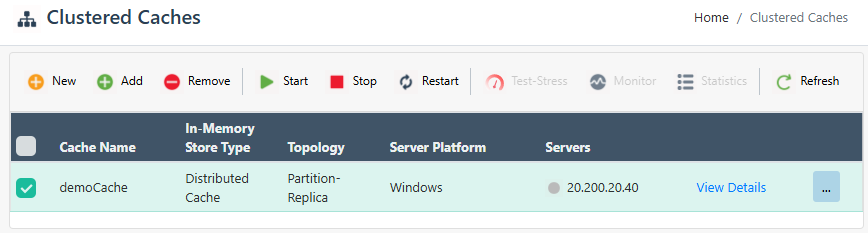
Create a new cache or select the cache you want to simulate.
Make sure that the cache is started.
You can run and monitor Test-Stress in either of the following ways:
Option 1: Run Test-Stress from the Toolbar
Select the cache you want to simulate.
On the toolbar, click on the Test-Stress button, which opens up a dialog box containing various time options.
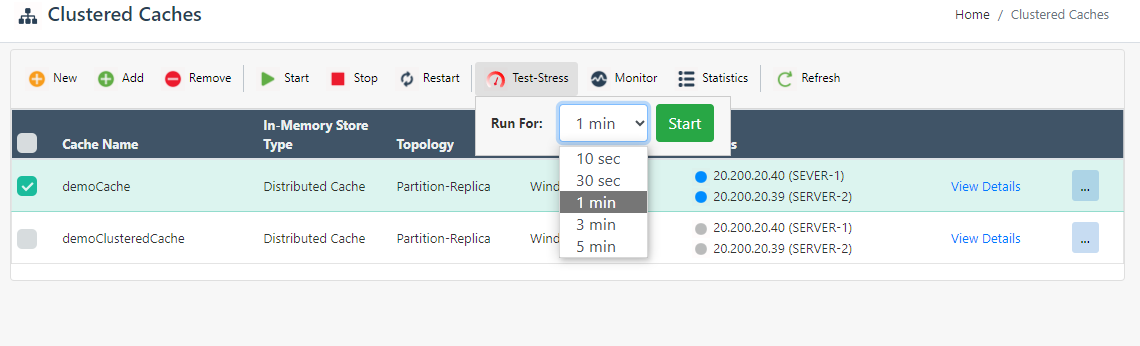
From the options list, you can select how much time you want Test-Stress to run. The options are:
- 10 seconds
- 30 seconds
- 1 minute
- 3 minutes
- 5 minutes
Click Start to begin the stress test.
You can then open Monitor or Statistics to observe the cache counters while the test is running.
Option 2: Open Monitor or Statistics from the Cache Menu
- Select the cache you want to simulate and click on the "..." button against it. This opens a dropdown menu of various operations that you can perform on the cluster.

From these options, select Monitor Cluster if you want to visually see the counters updating, or select Show Statistics if you want to view the statistics of the selected cache.
After the Monitor or Statistics view opens, click the Test-Stress button.
Select the Test-Stress duration:
- 10 seconds
- 30 seconds
- 1 minute
- 3 minutes
- 5 minutes
Click Start to begin the stress test.
During the selected duration, test data is added to your cache. After the specific expiration interval has elapsed, the data is removed from the cache.
The following sections explain both monitoring views.
View Simulation Through NCache Monitor
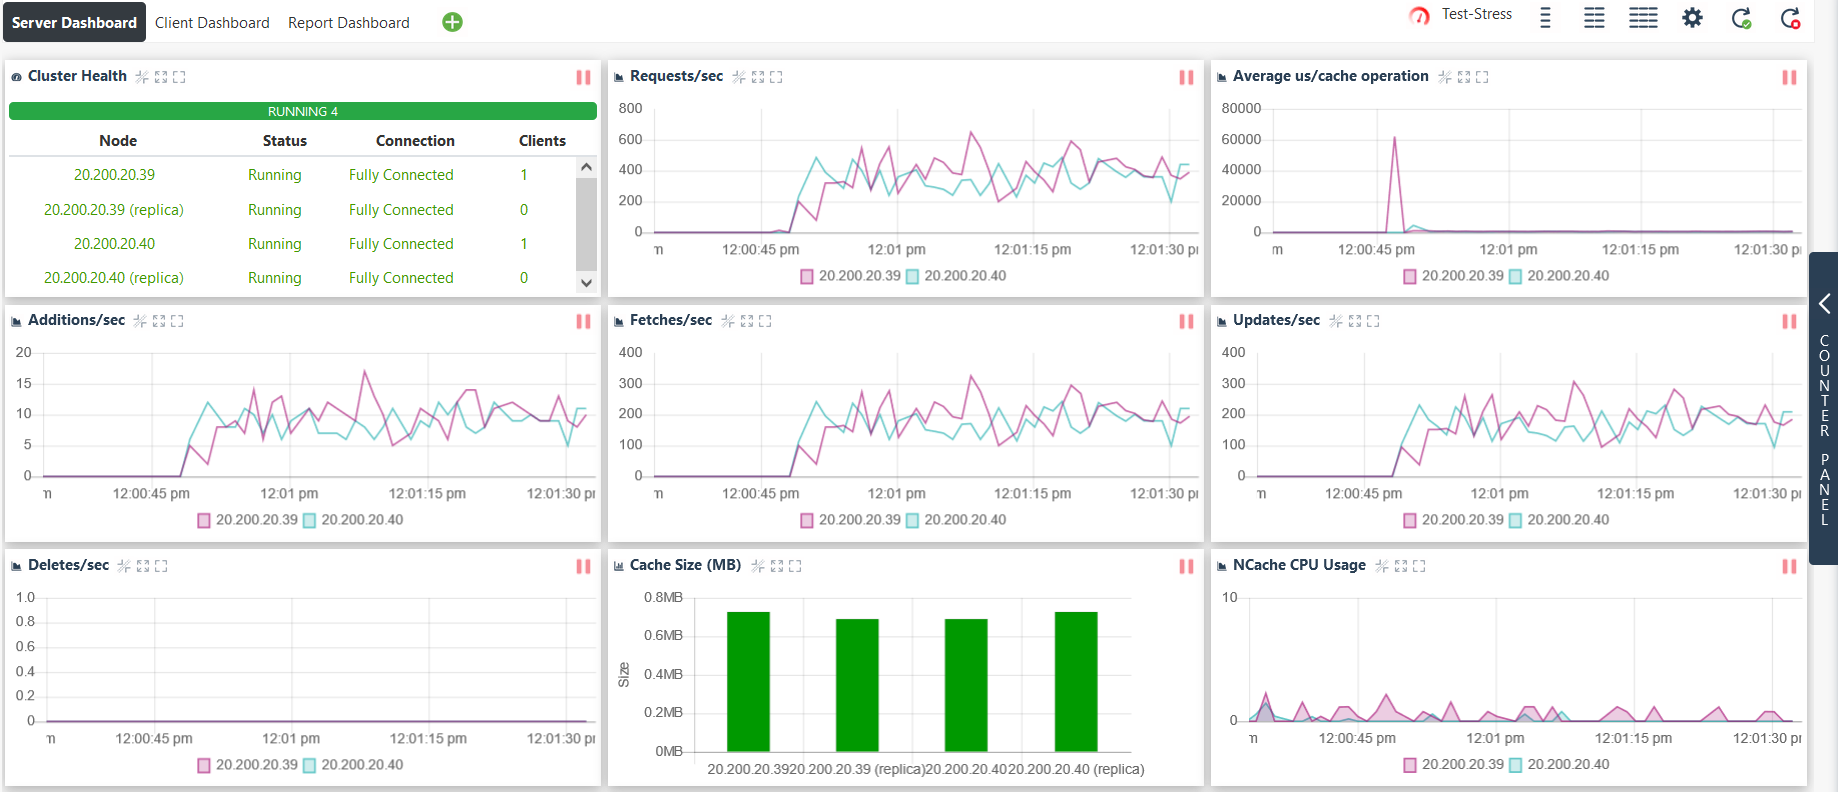
The NCache Monitor provides a graphical view dashboard to monitor various cache counters. If you choose to view cache usage simulation through the NCache Monitor, follow these steps:
- After clicking on the Monitor button, click on the Test-Stress button.
From the dropdown, you can choose the Test-Stress Timer for 10 or 30 seconds or 1, 3, or 5 minutes, depending on your choice.
As soon as you press the Start button, you can visualize the various cache operations on the monitoring dashboard.
You can view the data being added to the cache through the counters displayed on the NCache Monitor. After the set expiration interval has elapsed, the counters will show data being removed from the cache.
View Simulation Through NCache Statistics
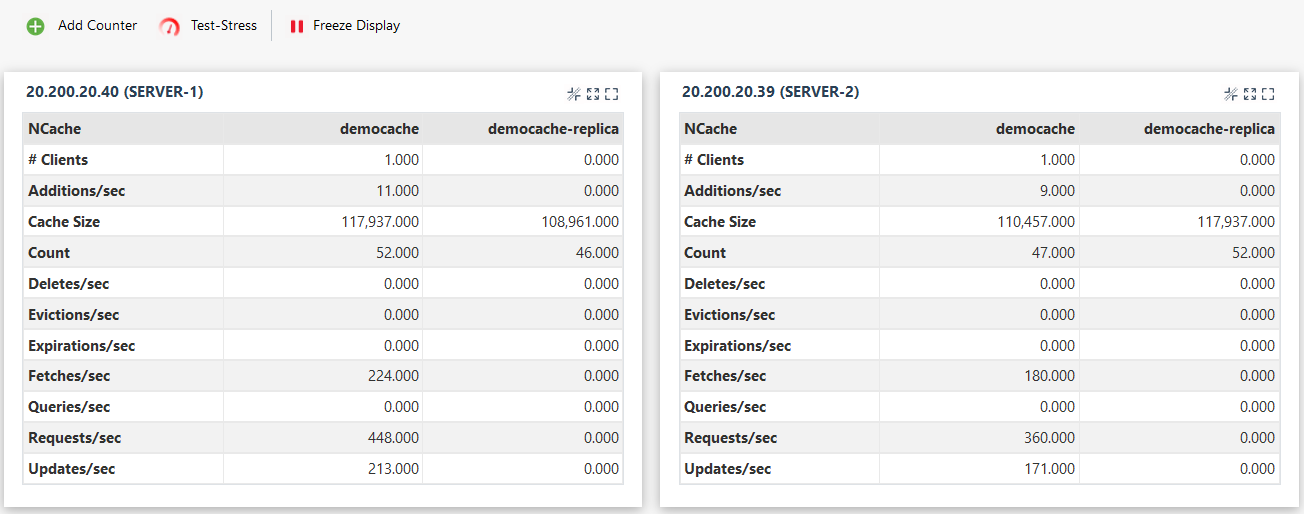
NCache Statistics provides a report view of Cache Counters. If you choose to simulate cache usage through statistics, then follow these steps:
- On the statistics board, click on the Test-Stress button. This opens up a dialog box through which you can customize your simulation.
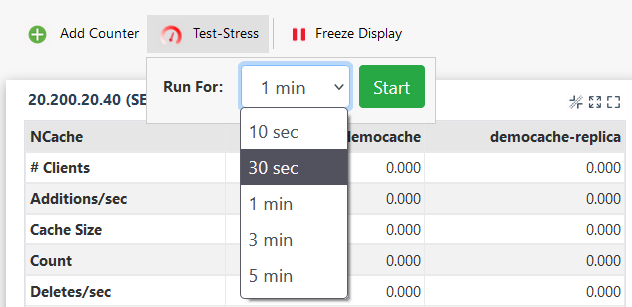
In the dialog box, you can choose the Test-Stress Timer for 10 or 30 seconds or 1, 3, or 5 minutes, depending on your choice.
As soon as you press the Start button, you can view the statistics for different operations on the cache, like Additions/sec and Fetches/sec.
You can view the data being added to the cache through the counters shown on the screen. After the set expiration interval has elapsed, the counters will show the data being removed from the cache.
Using PowerShell
You can also simulate cache usage under stress through the Test-Stress PowerShell cmdlet on a cache named demoCache on server 20.200.20.39 with default settings.
Test-Stress -CacheName demoCache -Server 20.200.20.39
See Also
NCache Counters
Monitor Caches using NCache Management Center
Monitor NCache using Windows PerfMon
