AWS CloudWatch Dashboards
NCache Cloud integrates directly with Amazon CloudWatch, provisioning a dedicated dashboard for each deployed environment (e.g., NCache-demo-env) during stack creation. The CloudWatch agent is deployed automatically on every cluster node, streaming metrics, logs, and traces directly into your AWS workspace via VPC endpoints without traversing the public internet.
You can either access the dashboard from the AWS Portal or through the AWS CloudWatch in the NCache Cloud Portal.
Accessing the Dashboard through AWS CloudWatch
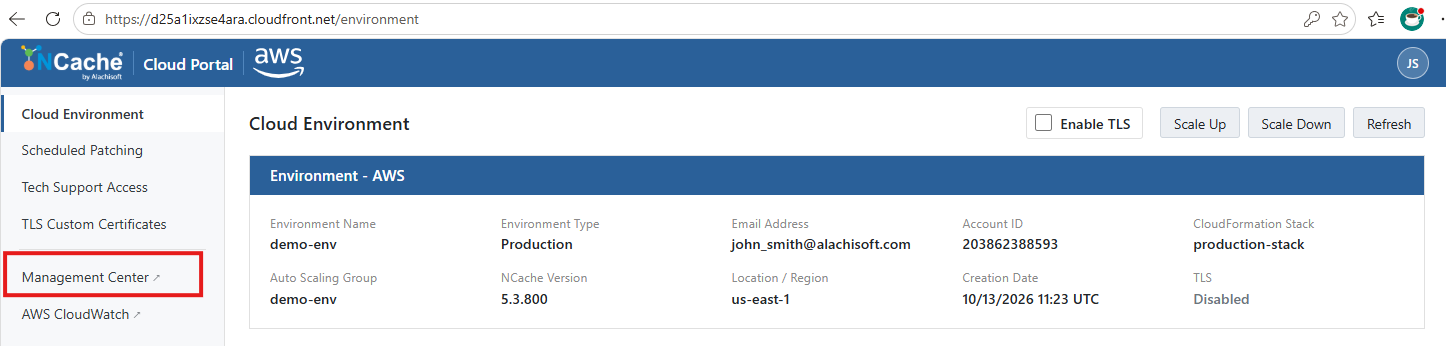
- Open the NCache Cloud Portal. Click on AWS CloudWatch.
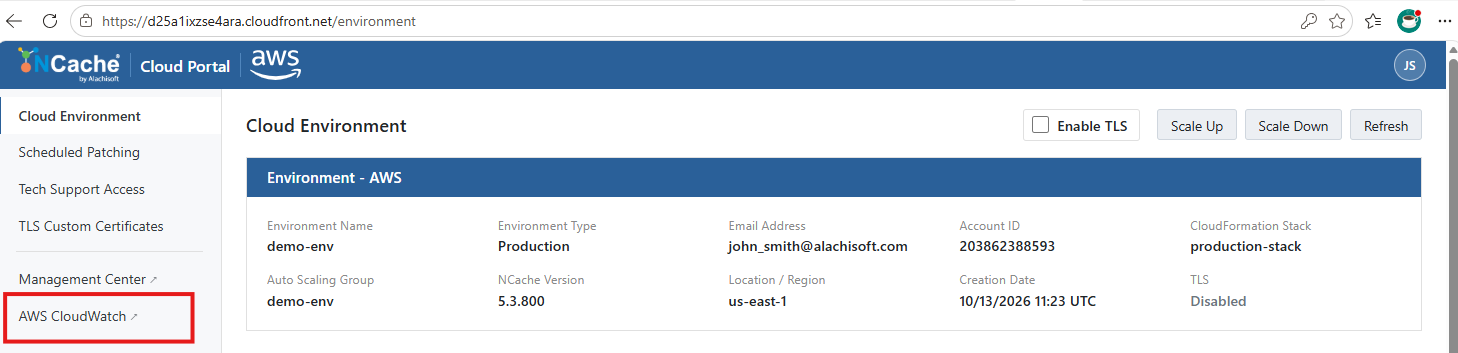
- Upon clicking this, you will be redirected to the AWS Portal's CloudWatch page.
Accessing the Dashboard through AWS Portal
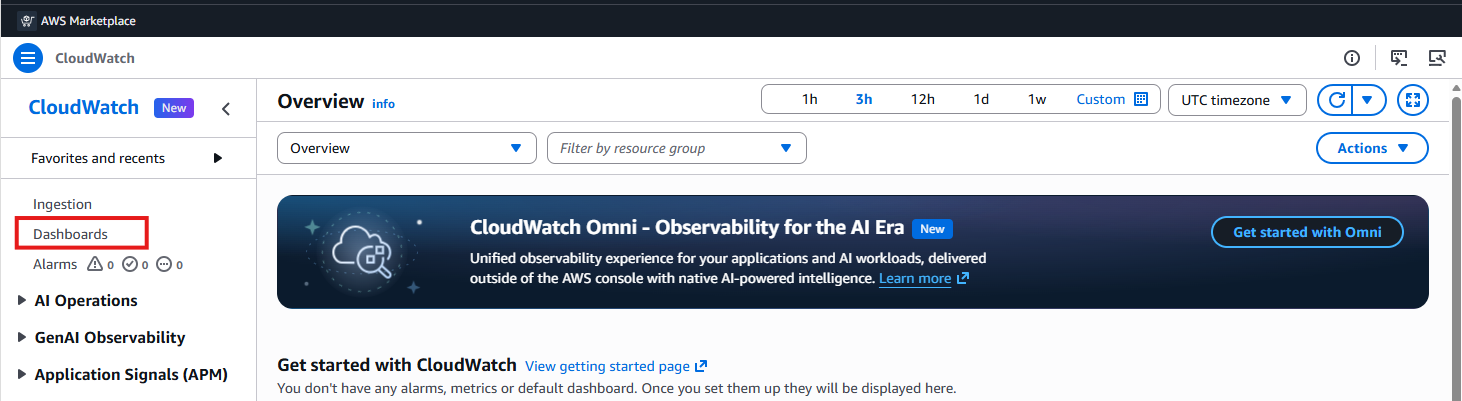
- In the global search bar at the top, type CloudWatch and select it from the services list.
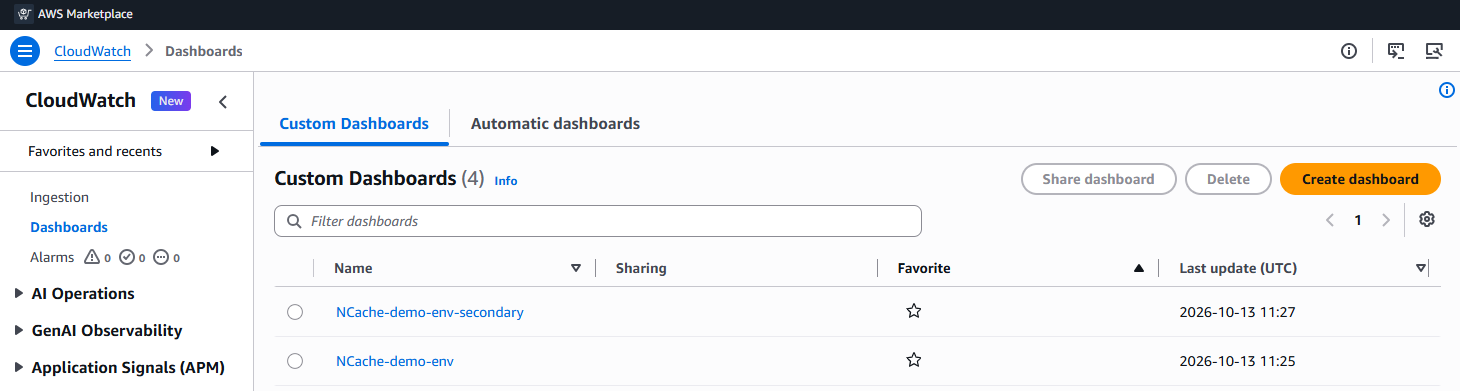
- Locate and select your environment's pre-configured dashboard (in the custom dashboards tab) from the list (named according to your deployment, such as NCache-demo-env).
Simulating Traffic with Test Stress
If your cluster has just been deployed, the metric panels will show No data because no application is actively reading or writing to the cache:
- Open the NCache Management Center via the NCache Cloud Portal.
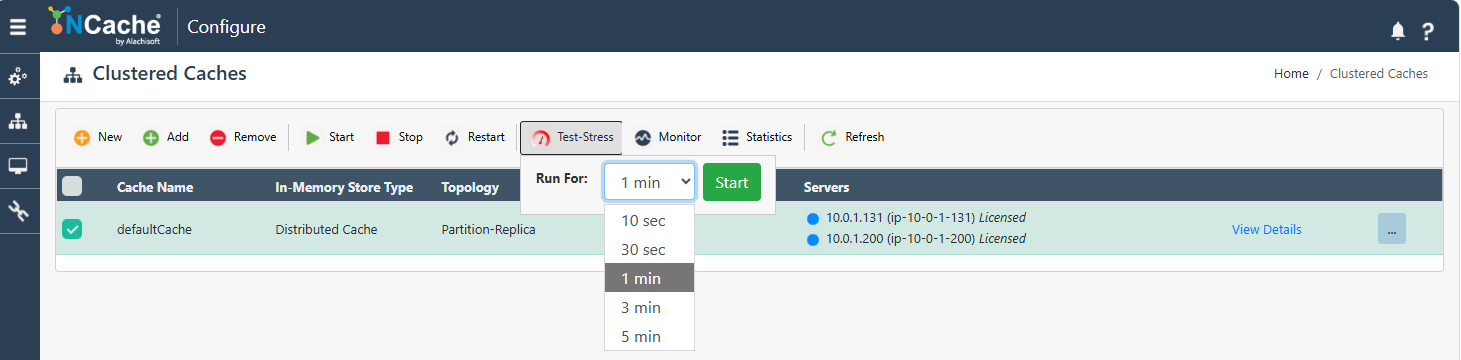
Navigate to Clustered Caches and select your cache (e.g., defaultcache).
Click the Test Stress button in the toolbar to simulate continuous cache read/write workloads.
- Return to your Cloudwatch dashboard in the AWS Portal and click Refresh (or wait for the automatic refresh cycle). The graphs will begin populating with live telemetry.
Filtering and Dashboard Controls
Time Range Selector (1h, 3h, 12h, 1d, 3d, 1w, Custom): Adjusts the historical window displayed across all panels. Selecting a shorter window (e.g., 1h or 3h) provides high-resolution, second-by-second granularity for active troubleshooting, while wider ranges (1d to 1w) help evaluate long-term capacity trends
Timezone Selector (UTC timezone): Switches the timeline axis between Coordinated Universal Time (UTC) and your local timezone for easier event correlation.
Auto-Refresh and Refresh Interval: Toggles live streaming telemetry and controls how frequently the dashboard polls for new data (e.g., refreshing every 5 minutes, or manually clicking the refresh icon to pull the latest 60-second scrape intervals).
Actions Dropdown: Use the Actions menu to manage, export, customize, and configure your CloudWatch dashboard settings and layout.
Performance & Throughput Panels
Additions/sec by cache: Measures the rate of new items being added to each cache instance over time.
Fetches/sec by cache: Tracks read request throughput and data retrieval frequency per cache.
Updates/sec by cache: Monitors the volume of write and update operations executed per second.
Deletes/sec by cache: Quantifies item eviction and removal rates across active caches.
Host Resource Utilization
CPU utilization by node (busy states, stacked = total): Breaks down CPU demand across individual EC2 instances (i-0fb0e82e255a88eb5, i-073de1971867d39c3, etc.), distinguishing between system processes and user/wait states.
Memory utilization by node (used): Tracks active memory consumption percentages across all cluster nodes to prevent resource exhaustion.
Node Report and NCache Logs
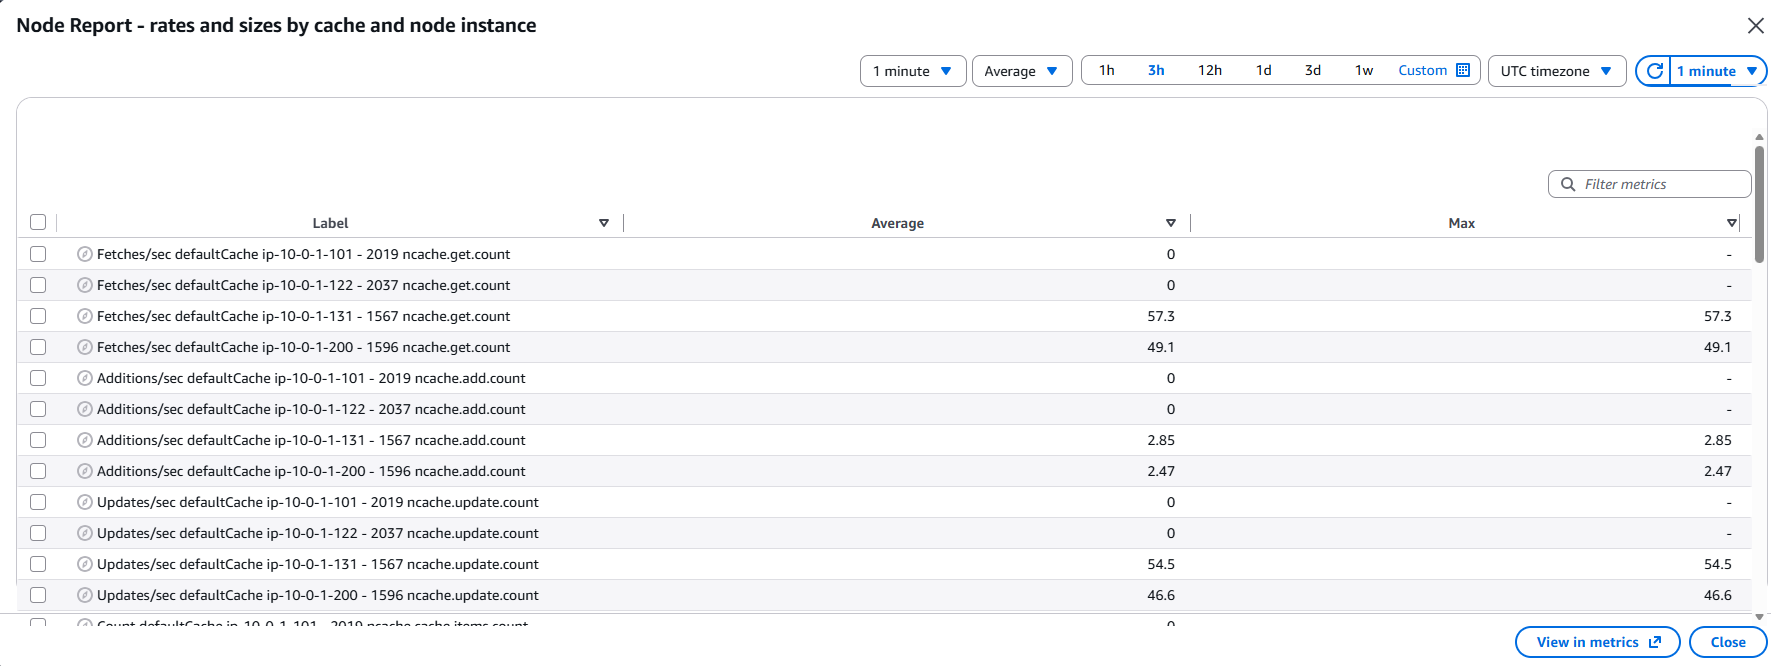
- Node Report: Provides a tabular breakdown of rates and sizes grouped by cache and individual node instances, featuring inline metric filtering.
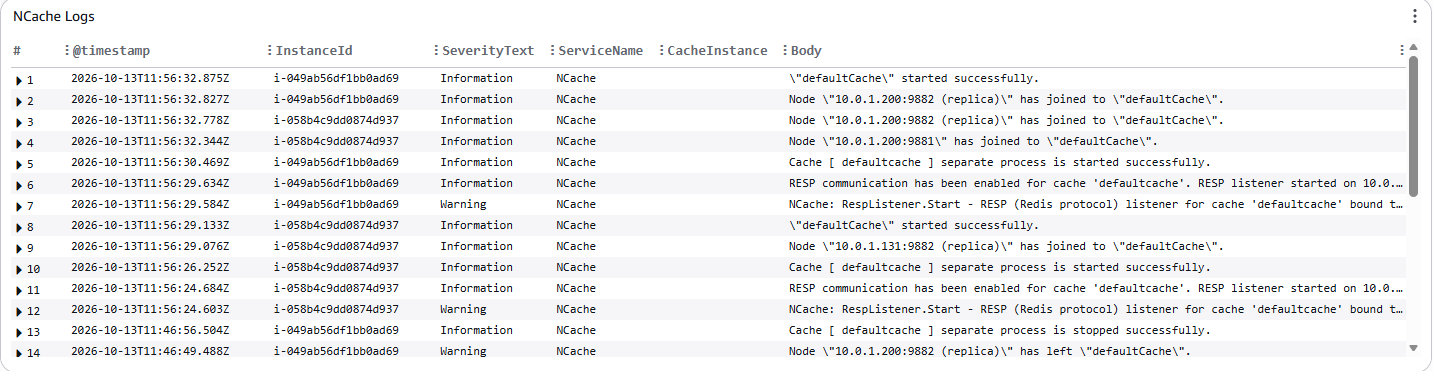
- NCache Logs: Real-time log stream capturing container events, cluster node joins/leaves (e.g., replica synchronization), listener statuses (e.g., REST/RESP protocol binding on port 9981), and service lifecycle events.