Simulate NCache with Test Stress
To simulate the usage of your created caches, NCache provides the Test Stress option. The Test Stress mechanism simulates a heavy transactional load on your specified caches.
Note
This feature is also available in the NCache Community Edition.
Note
You can simulate the usage of different store types and monitor Cache Counters for your cache by following the same steps listed below.
Using the NCache Management Center
Follow the steps mentioned below to simulate your cache usage under stress through the NCache Management Center:
Launch the NCache Management Center by browsing http://localhost:8251 or
<server-ip>:8251on Windows and Linux.From the left navigation bar, click on Clustered Caches.
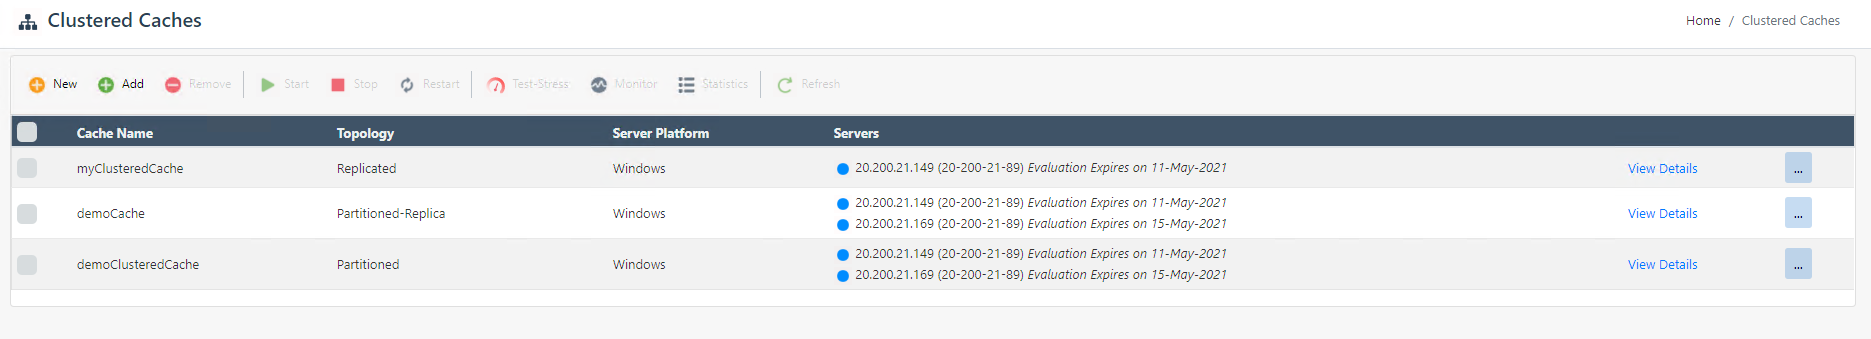
Create a new cache or select the cache you want to simulate.
Make sure that the cache is started.
On the toolbar, click on the Test-Stress button, which opens up a dialogue box containing various time options.

From the options list, you can select how much time you want the Test-Stress to run. The options are:
- 10 seconds
- 30 seconds
- 1 minute
- 3 minutes
- 5 minutes
This is the time for which the data keeps on adding to your cache, and after this specific expiration time has elapsed, the data will be removed from the cache.
To see how these cache counters are updating, you have two options. Either click on the Monitor option on the toolbar (next to Test-Stress) and visualize the cache counters or the Statistics option to monitor the statistics of your particular cache.
Following are the details provided for both of the above options.
View Simulation Through the NCache Monitor
The NCache Monitor provides a graphical view dashboard to monitor various cache counters. If you choose to view cache usage simulation through the NCache Monitor, follow these steps:
- After clicking on the Monitor button, next click on the Test-Stress button.
From the dropdown, you can choose the Test-Stress Timer for 10 or 30 seconds or 1, 3, or 5 minutes, depending on your choice.
As soon as you press the Start button, you can visualize the various cache operations that take place on the client dashboard.
You can view the data being added in the cache through the counters displayed on the NCache Monitor. After the set expiration interval has elapsed, the counters will show data being removed from the cache.

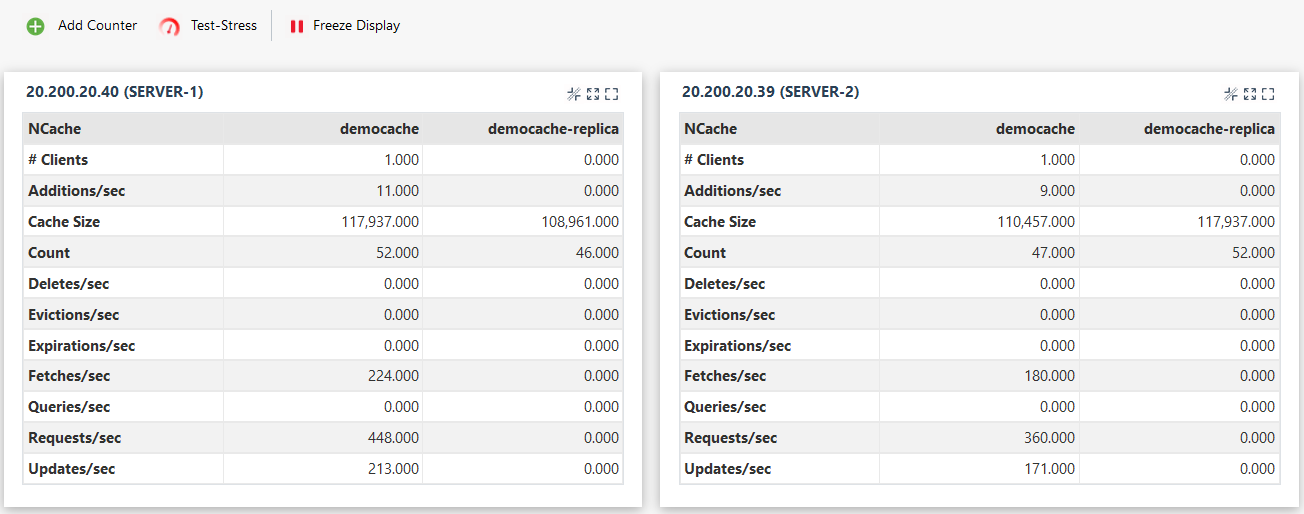
View Simulation Through NCache Statistics
NCache Statistics provides a report view of various Cache Counters. If you choose to simulate cache usage through statistics, then follow these steps:
- On the statistics board, click on the Test-Stress button. This opens up a dialog box through which you can customize your simulation.

In the dialogue box, you can choose the Test-Stress Timer for 10 or 30 seconds or 1, 3, or 5 minutes, depending on your choice.
As soon as you press the Start button, you can view the statistics for different operations on the cache, like Additions/sec and Fetches/sec.
You can view the data being added to the cache through the counters shown on the screen. After the set expiration interval has elapsed, the counters will show the data being removed from the cache.
Using Command Line Tools
You can also simulate your cache usage under stress through the PowerShell cmdlet. The following command executes Test-stress on cache named demoCache on Server 20.200.20.39 with default settings.
See Also
NCache Counters
Monitor Caches using NCache Management Center
Monitor NCache using Windows PerfMon Tool