• Products
  • Solutions
  • Customers
  • Resources
  • Company
  • Pricing
  • Download
Try Playground
  • Configure Caches
  • Add Test Data
Show / Hide Table of Contents
  • Administrator's Guide
  • NCache Architecture
    • Cache Topologies
      • Partitioned Topologies
      • Replicated Topology
      • Mirrored Topology
      • Scalability in Topologies
    • Dynamic Clustering
    • Local Cache
    • Cache Client
    • Client Cache
    • Bridge for WAN Replication
    • Connectivity with Load Balancer
    • Serialization Format
    • Data Encryption
    • Data Compression
    • Data Load Balancing
    • Pipelining
    • Cache Server Backward Compatibility
    • Client Backward Compatibility
    • Eviction
    • Indexing
    • Split-Brain
    • Maintenance Mode
    • Runtime Data Sharing
    • Portable Data Types
    • Class Versioning
    • IP Binding with Multiple NICs
    • Graceful Node Down
    • Separate Cache Host Process
    • Self Healing Dynamic Clustering
    • Distributed Cache with Persistence
  • NCache Management Center
  • Configure Caches
    • Create a Cache
      • Local Cache Overview
        • Local Cache
        • Local Cache with Persistence
        • Pub/Sub Messaging Cache
        • Add Existing Cache
      • Clustered Cache Overview
        • Distributed Cache
        • Persistent Distributed Cache
        • Pub/Sub Messaging Cache
        • Add Existing Clustered Cache
        • Troubleshooting
    • Remove Cache
    • Clear Cache
    • Add Server Node
    • Remove Server Node
    • Add Test Data
    • Configure Query Indexes
    • Configure JSON Query Indexes
    • Compact Serialization
      • Non-Generic Registration
      • Non-Generic Unregistration
      • Generic Registration
      • Using Type Handler
    • Deploy Providers
    • Configure Custom Dependency
    • Add Data Source Providers
      • Read-Through Provider
      • Write-Through Provider
      • Write-Behind Provider
    • Loader and Refresher
    • Configure Maintenance Mode
      • Stop for Maintenance Mode
      • Exit Maintenance Mode
    • Configure LINQPad
      • Configure LinqPad for NCache
      • Querying Data in LinqPad
  • Configure Clients
    • Add Client Node
    • Remove Client Node
  • Configure Client Cache
    • Create Client Cache
    • Create Client Cache with NuGet
    • Enable Client Cache on Client Nodes
    • Disable Client Cache on Client Nodes
    • Remove Client Cache
  • Management Operations
    • Start Cache
    • Stop Cache
    • Restart Cache
    • Manage Cache Service on a Server Node
    • Memory Dumps
    • Data Load Balancing
    • Invoke Refresher Dataset
    • Import/Export Cache Data
    • Import Lucene Indexes
    • Suspend/Resume NCache Data Persistence
    • Backup and Restore NCache Persisted Data
  • Cache Settings
    • General Cache Settings
      • Cache Size
      • Cache Isolation Levels
      • Cache Serialization Format
      • Cache Data Expiration
    • Cache Cluster Settings
      • Ports
      • Operation Timeout
      • Configure Pipelining
      • Static Replication Interval
      • Connection Retries
      • Retry Interval
      • Split-Brain Auto Recovery
    • NCache Persistence Settings
      • Store Information
      • Persistence Interval
    • Error Logging
    • Cache Level Events
    • Client Activity Events
    • Eviction Policy
    • MapReduce
    • Register Classes for Portable Data Sharing
    • Compression
    • Email Notifications
    • Bind IP with Multiple NICs
      • Bind Cluster with a Dedicated IP
      • Bind Client/Server with a Dedicated IP
    • Heartbeat
    • Keep Alive
    • Client Death Detection
    • Communication Reliability
    • Auto Start Cache on Boot
    • Nagle's Algorithm
    • Dual Socket
    • Configuration Files
      • Client Side Configurations
        • Client Config
        • EFCaching Config
      • Server Side Configurations
        • Cache Config
        • Bridge Config
        • Modules Config
        • Security Config
        • TLS Config
        • Monitoring Config
        • Emails Template
  • Cache Server Settings
    • Server Connectivity
    • Bind to Multiple NICs
    • Server Ports
    • Memory
    • Custom Dependency
    • Request Inquiry
    • Windows Events
    • Message Events
    • Expiration & Eviction
    • SQL Server
    • Logging
    • Monitoring
    • Persistence Data Loading Retries
    • Miscellaneous Configurations
  • Bridge Server Settings
  • Cache Client Settings
  • Client Cache Settings
  • Configure Security
    • Configure Authentication and Authorization
    • Configure Encryption for Cache
    • Configure TLS Encryption
    • Configure HTTPS for NCache Management Center
  • Configure Bridge for WAN Replication
    • Create Bridge
    • Add Clustered Caches to Bridge
    • Configure Bridge Settings
    • Change Cache Synchronization Modes
    • Bridge Management
    • Synchronize Caches in Bridge
    • Leave Bridge
    • Remove Cache from Bridge
    • Configure Conflict Resolver
  • Setup Database for Cache Synchronization
    • Setup SQL Server Environment
    • Setup Oracle Database Environment
    • Setup OleDb Environment
    • Setup SQL Server for CLR Procedures
  • Simulate NCache Usage
  • Monitor Caches
    • Counters
      • Distributed Cache Counters
      • Distributed Cache with Persistence Counters
      • Pub/Sub Messaging Cache Counters
      • Distributed Lucene Cache Counters
      • Cache Client Counters
      • Bridge Counters
    • Monitor NCache using the NCache Management Center
      • Using Tabular Statistics
        • Configure Counters to Display Caching Statistics
        • Configure Counters to Display Pub/Sub Statistics
        • Configure Counters to Display Lucene Statistics
        • Configure Counters to Display Bridge Statistics
        • Browse Cache Statistics
        • Monitor Bridge
      • Using Monitoring Dashboards
        • Configure Monitor Settings
        • Configure Event Logging
        • Configure API Logging
        • Monitor with a Built-In NCache Monitor Dashboard
        • Monitor with the NCache Monitor Custom Dashboard
        • Monitor Cluster Connectivity
        • Monitor Cache Clusters using NCache Email Alerts
    • Monitor Cache Using Command Line Tools
      • Monitor Cache Server Statistics with Command Line Tools
      • Monitor Cache Client Statistics with Command Line Tools
    • Monitor NCache Using Windows PerfMon Tool
      • Monitoring Cache Server Counters using PerfMon
      • Monitoring Cache Client Counters using PerfMon
      • Monitor Bridge Counters Using PerfMon Tool
    • Monitor NCache using Prometheus
    • Monitor NCache using Grafana
    • Monitor NCache Using SNMP Counters
    • Monitor NCache Using JMX Counters
    • Logging
      • NCache Log Viewer
      • Performance Counters Logging
      • Windows Event Logging
      • Cache Health Alerts
      • Email Notifications on NCache Events
      • Cache Server Logging
      • Client Side API Logging
      • Cache Event IDs
      • Feature Usage Logging
    • Troubleshooting NCache Monitoring
      • Computer Name Not Found
      • Diskperf Not Installed
      • No READ Access to Perflib Subkeys
      • Unable to Connect to Remote Server
    • IPV6 Support

Add Test Data To Verify Cache Performance

You can quickly run a Stress Test Tool that comes with NCache installation to verify that cache clients can make calls to cache servers. This tool starts making cache calls to the cache servers as it simulates a transactional load on the specified caache. You can monitor the cache performance using the PerfMon counters and NCache Monitor.

Note

This feature is also available in NCache Professional.

Verify Cache Performance Using the Management Center

Follow the steps mentioned below to simulate your cache usage under stress through the NCache Management Center:

  • Launch the NCache Management Center by browsing http://localhost:8251 (Windows) or <server-ip>:8251 (Windows+Linux).

  • From the left navigation bar, click on Clustered Caches.

NCache Management Center Clustered Caches

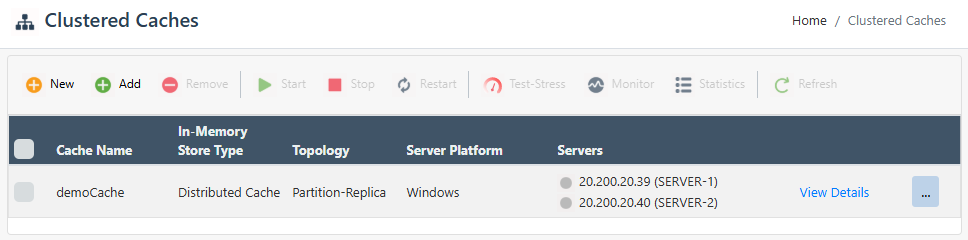
  • Select the cache you want to simulate and click on the "..." button against it. This will open up a dropdown menu of various operations that you can perform on a cluster.

NCache Management Center Clustered Cache Dropdown Menu

  • From these options, select Monitor Cluster if you want to visually see the counters updating, or select Show Statistics if you want to view the stats of the cache you want to simulate.

Verify Cache Performance Using the NCache Monitor

The NCache Monitor provides a graphical view dashboard to monitor various cache counters. If you choose to view cache usage simulation through the NCache Monitor, follow these steps:

  • Click on the Test-Stress button. This will open up a dialog box through which you can customize your simulation.

NCache Simulate Test Stress Data

  • In the dialogue box, you can choose the Test-Stress Timer for 10 or 30 seconds or 1, 3, or 5 minutes, depending on your choice.
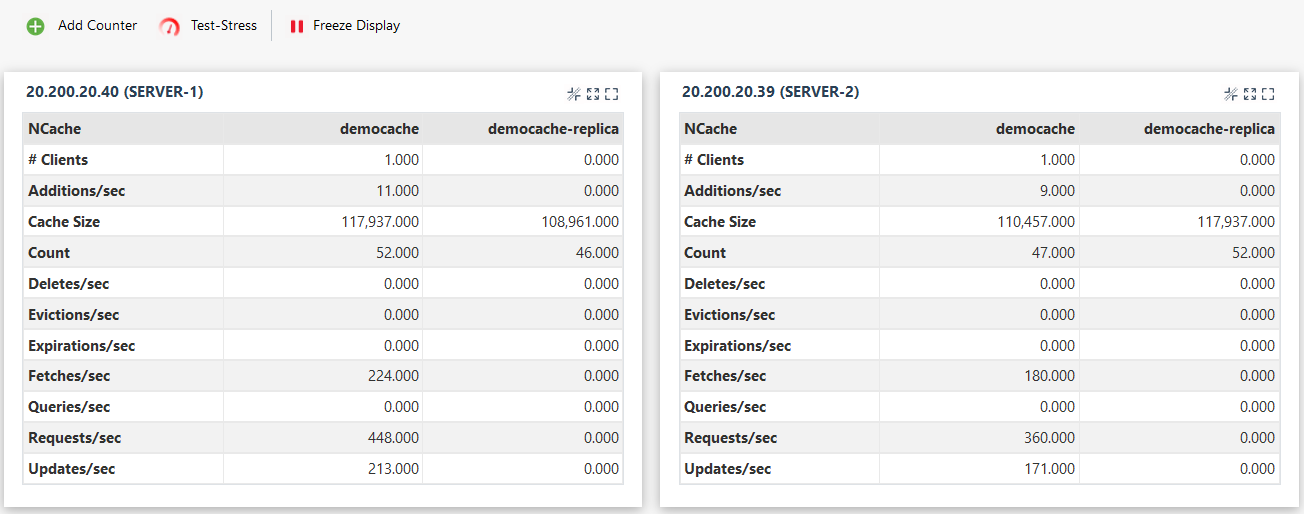
  • As soon as you press the Start button, you can visualize the various cache operations that take place on the client dashboard.

  • You can view that the data is being added to the cache through the counters displayed on the NCache Monitor. After the set expiration interval has elapsed, the counters will show data being removed from the cache.

Using NCache Statistics

NCache Statistics provides a report view of various cache counters. If you choose to simulate cache usage through statistics, then follow these steps:

NCache Statistics

  • On the statistics board, click on the Test-Stress button. This opens up a dialog box through which you can customize your simulation.
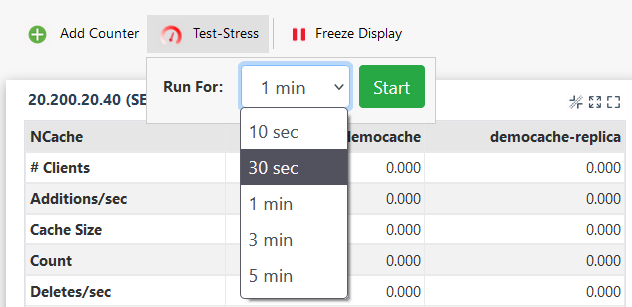
NCache Simulate Test Stress Data

  • In the dialogue box, you can choose the Tess-Stress timer for 10 or 30 seconds or 1, 3, or 5 minutes, depending on your choice.

  • As soon as you press the Start button, you can view the statistics for different operations on the cache like Additions/sec and Fetches/sec.

  • You can view that the data is being added to the cache through the counters shown on the screen. After the set expiration interval has elapsed, the counters will show data being removed from the cache.

NCache Stats Counter Dashboard

Verify Cache Performance Using Command Line Tools

The Add Test Data tool enables the user to add some test data to the cache to check if the cache has started and is working properly.

The following command adds test data to the cache named demoCache. It adds 40 items to the cache and the data added will expire after the time duration of 5 minutes.

  • Windows
  • Linux
Add-TestData –CacheName demoCache –ItemCount 40
add-testdata -cachename demoCache -itemcount 40

See Also

Create a Cache
Remove Cache
Remove Server Node
Configure Query Indexes

In This Article
  • Verify Cache Performance Using the Management Center
    • Verify Cache Performance Using the NCache Monitor
    • Using NCache Statistics
  • Verify Cache Performance Using Command Line Tools
  • See Also

Contact Us

PHONE

+1 (214) 764-6933   (US)

+44 20 7993 8327   (UK)

 
EMAIL

sales@alachisoft.com

support@alachisoft.com

NCache
  • NCache Enterprise
  • NCache Professional
  • Edition Comparison
  • NCache Architecture
  • Benchmarks
Download
Pricing
Try Playground

Deployments
  • Cloud (SaaS & Software)
  • On-Premises
  • Kubernetes
  • Docker
Technical Use Cases
  • ASP.NET Sessions
  • ASP.NET Core Sessions
  • Pub/Sub Messaging
  • Real-Time ASP.NET SignalR
  • Internet of Things (IoT)
  • NoSQL Database
  • Stream Processing
  • Microservices
Resources
  • Magazine Articles
  • Third-Party Articles
  • Articles
  • Videos
  • Whitepapers
  • Shows
  • Talks
  • Blogs
  • Docs
Customer Case Studies
  • Testimonials
  • Customers
Support
  • Schedule a Demo
  • Forum (Google Groups)
  • Tips
Company
  • Leadership
  • Partners
  • News
  • Events
  • Careers
Contact Us

  • EnglishChinese (Simplified)FrenchGermanItalianJapaneseKoreanPortugueseSpanish

  • Contact Us
  •  
  • Sitemap
  •  
  • Terms of Use
  •  
  • Privacy Policy
© Copyright Alachisoft 2002 - 2025. All rights reserved. NCache is a registered trademark of Diyatech Corp.
Back to top