Cluster Health
Cluster health alerts in NCache is a server-side monitoring mechanism that actively monitors key system resources (CPU, Memory, Network) and cache metrics. You can set both minimum and maximum thresholds, and you will be notified via an event logged in the cache log file and event viewer whenever the resource usage goes beyond the defined limits, i.e., if the monitored value is higher than or equal to a maximum threshold value or it is lower than or equal to a minimum threshold value.
Note
This feature is only provided for OutProc caches.
Configure Distributed Cache Health Alerts
The resources are provided in an alerts.xml file placed at %NCHOME%\config (Windows) or /opt/ncache/config (Linux). You can enable or disable the Cache Health Alerts through the cache-health-alerts tag in the configuration file. It is disabled by default. Moreover, as mentioned, logging is provided in both event and cache logs. So the logging interval for both cache and event logs can be configured using the following tag.
Note
Both the event logging interval and cache logging interval have the value in minutes.
<cache-health-alerts enable ="true" event-logging-interval ="60" cache-logging-interval ="10">
Important
Please ensure to restart the cache after the configuration changes.
Once enabled, alerts are logged in the following locations:
The NCache Cache Log (located in
%NCHOME%\log-filesor as defined in cache config).The Windows Event Viewer under:
- Windows Logs > Application
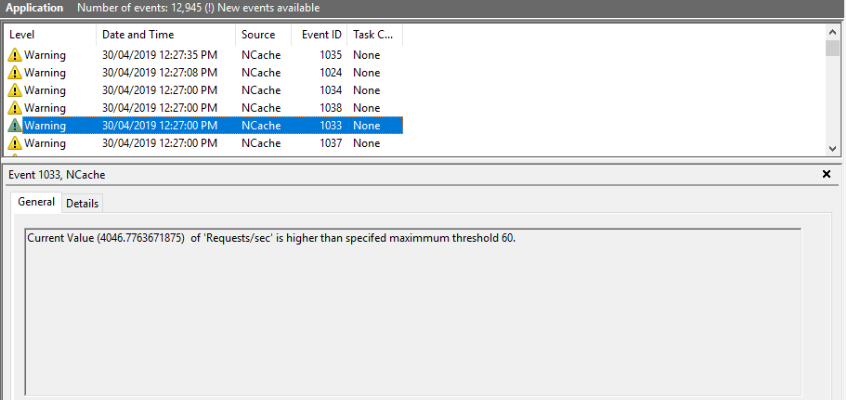
The events are logged in the Event Viewer as shown below:
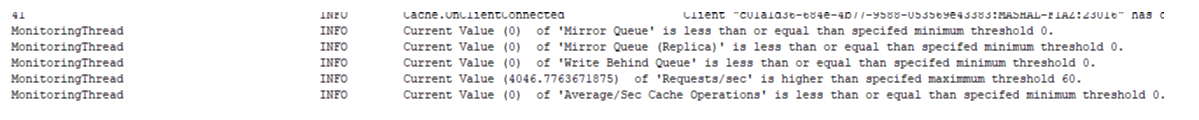
Similarly, the events are logged in the cache logs as shown below:
Resources
Given below is the list of all resources being monitored in the xml file. The values of their minimum and maximum threshold are configurable by the user within a particular range. These values are also described below.
Memory: The percentage value of memory consumed by a cache host process. The percentage is calculated with respect to cache size. In the case of Partition-Replica, the size of the replica is also included in the percentage calculation. The minimum and maximum threshold values that can be set for this resource are 0 and 100 respectively.
Network: The percentage value of bandwidth consumed by a cache host process. The minimum and maximum threshold values that can be set for this resource are 0 and 100 respectively.
CPU: The percentage value of the processor consumption by the cache host process. The minimum and maximum threshold values that can be set for this resource are 0 and 100 respectively.
Request-per-second: The number of requests (cache commands, e.g., add, remove, fetch, etc.) processed by the cache server per second. The minimum threshold value that can be set is 1000. However, there is no maximum threshold value for this resource.
Bridge-queue: The number of items in the Bridge queue of NCache. There is no minimum threshold value for this resource. However, the maximum threshold value that can be set is 1000.
Client-connections: Number of connected clients to a cache during the logging interval. There is no maximum or minimum threshold value for this parameter.
Mirror-queue: The number of items in the Mirror queue of a cache. In the case of Partition-Replica, the Replica Mirror queue will also be monitored. There is no minimum threshold value for this resource. However, the maximum threshold value that can be set is 1000.
Write-behind queue: The number of operations in the Write-Behind queue. There is no minimum threshold value for this resource. However, the maximum threshold value that can be set is 1000.
Average-cache-operation: Average time, in microseconds, taken to complete one cache operation. There is no minimum threshold value for this resource. However, the maximum threshold value that can be set is 1000.
A single resource has the following properties:
| Properties | Description | Unit |
|---|---|---|
-name |
Name of the resource. | - |
-min-threshold |
If the resource usage value is less than or equal to the value provided, logging will start. | - Percentage: memory, Network, CPU. - Number: Rest of the counters. |
-max-threshold |
If the resource usage value is equal to or greater than the value provided, logging will start. | - Percentage: memory, Network, CPU. - Number: Rest of the counters. |
-duration |
Logging interval in seconds in which a resource value will be monitored. The minimum value for the duration is 5 seconds and the maximum value is 15 seconds. | Seconds. |
Note
For any counter with threshold values ranging between 0 to 100, if both (minimum and maximum) threshold values are set to 0, the value of the maximum threshold will be automatically changed to 50. Otherwise, if the value provided for the maximum threshold is lesser than the minimum value provided, the maximum threshold will be calculated according to the given formula:
Maximum Threshold = Minimum Threshold / 2
See Also
NCache Log Viewer
Performance Counters Logging
Email Notifications on NCache Events