| < Previous page | Next page > |
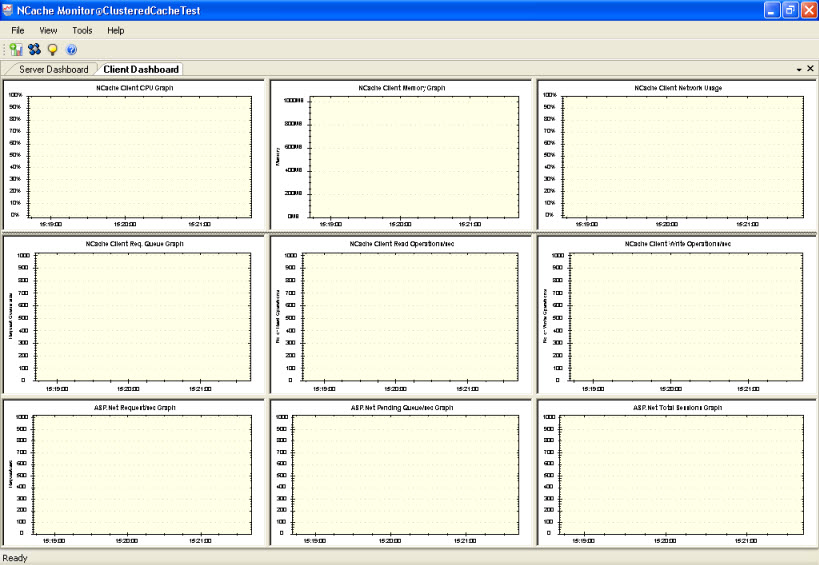
Client Dashboard
Client Dashboard is one of the default dashboards which appears automatically after the selection of a cluster. Client dashboard cannot be modified, however you can retrieve client dashboard any time using View option. Client dashboard contains following graphs:
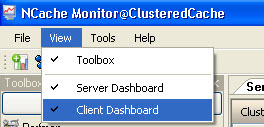
You can view the cluster Dashboard from the following option:
NCache Client CPU Graph
% Processor Time is the percentage of elapsed time that a processor spends to execute a non-Idle thread. It is calculated by measuring the duration in which an idle thread is active in sample interval and subtracting from total interval. (Each processor has an idle thread that consumes cycles when no other threads are ready to run). This counter is the primary indicator of processor activity, and displays the average percentage of busy time observed during the sample interval. It is calculated by monitoring the time that the service is inactive, and subtracting that value from 100%. It is against the Total instance. The category of this graph is Processor and the counter is % Processor Time.
NCache Client Memory Graph
Committed Bytes is the amount of committed virtual memory, in bytes. Committed memory is the physical memory which has space reserved on the disk paging file(s). There can be one or more paging files on each physical drive. This counter displays the last observed value only; it is not an average. The category of this graph is Memory and the counter is Committed Bytes.
NCache Client Network Usage Graph
NCache Client Network Usage graph contains two counters:
This category of this graph is NCache Client.
NCache Client Req Queue Graph
This graph shows the total number of requests from all clients on a single machine waiting for response from cache server. The category of this graph is NCache Client and the counter is Request Queue Size/sec.
NCache Client Read Ops/sec
This graph shows the number of Read operations per second. The category of this graph is NCache Client and the counter is Read Operations/sec.
NCache Client Write Ops/sec
This graph shows the number of Write operations per second. The category of this graph is NCache Client and the counter is Write Operations/sec.
ASP.NET Requests/sec Graph
This graph shows the number of requests executed per second. It is against the Total instance. The category of this graph is ASP.NET Applications and the counter is Requests/sec.
ASP.NET Pending Queue/sec Graph
This graph shows the number of requests in the application request queue. It is against the Total instance. The category of this graph is ASP.NET Applications and the counter is Requests in Application Queue.
ASP.NET Total Sessions Graph
This graph shows the total number of sessions since the application was started. It is against the Total instance. The category of this graph is ASP.NET Applications and the counter is Session Total.
See Also
|