Client Dashboard
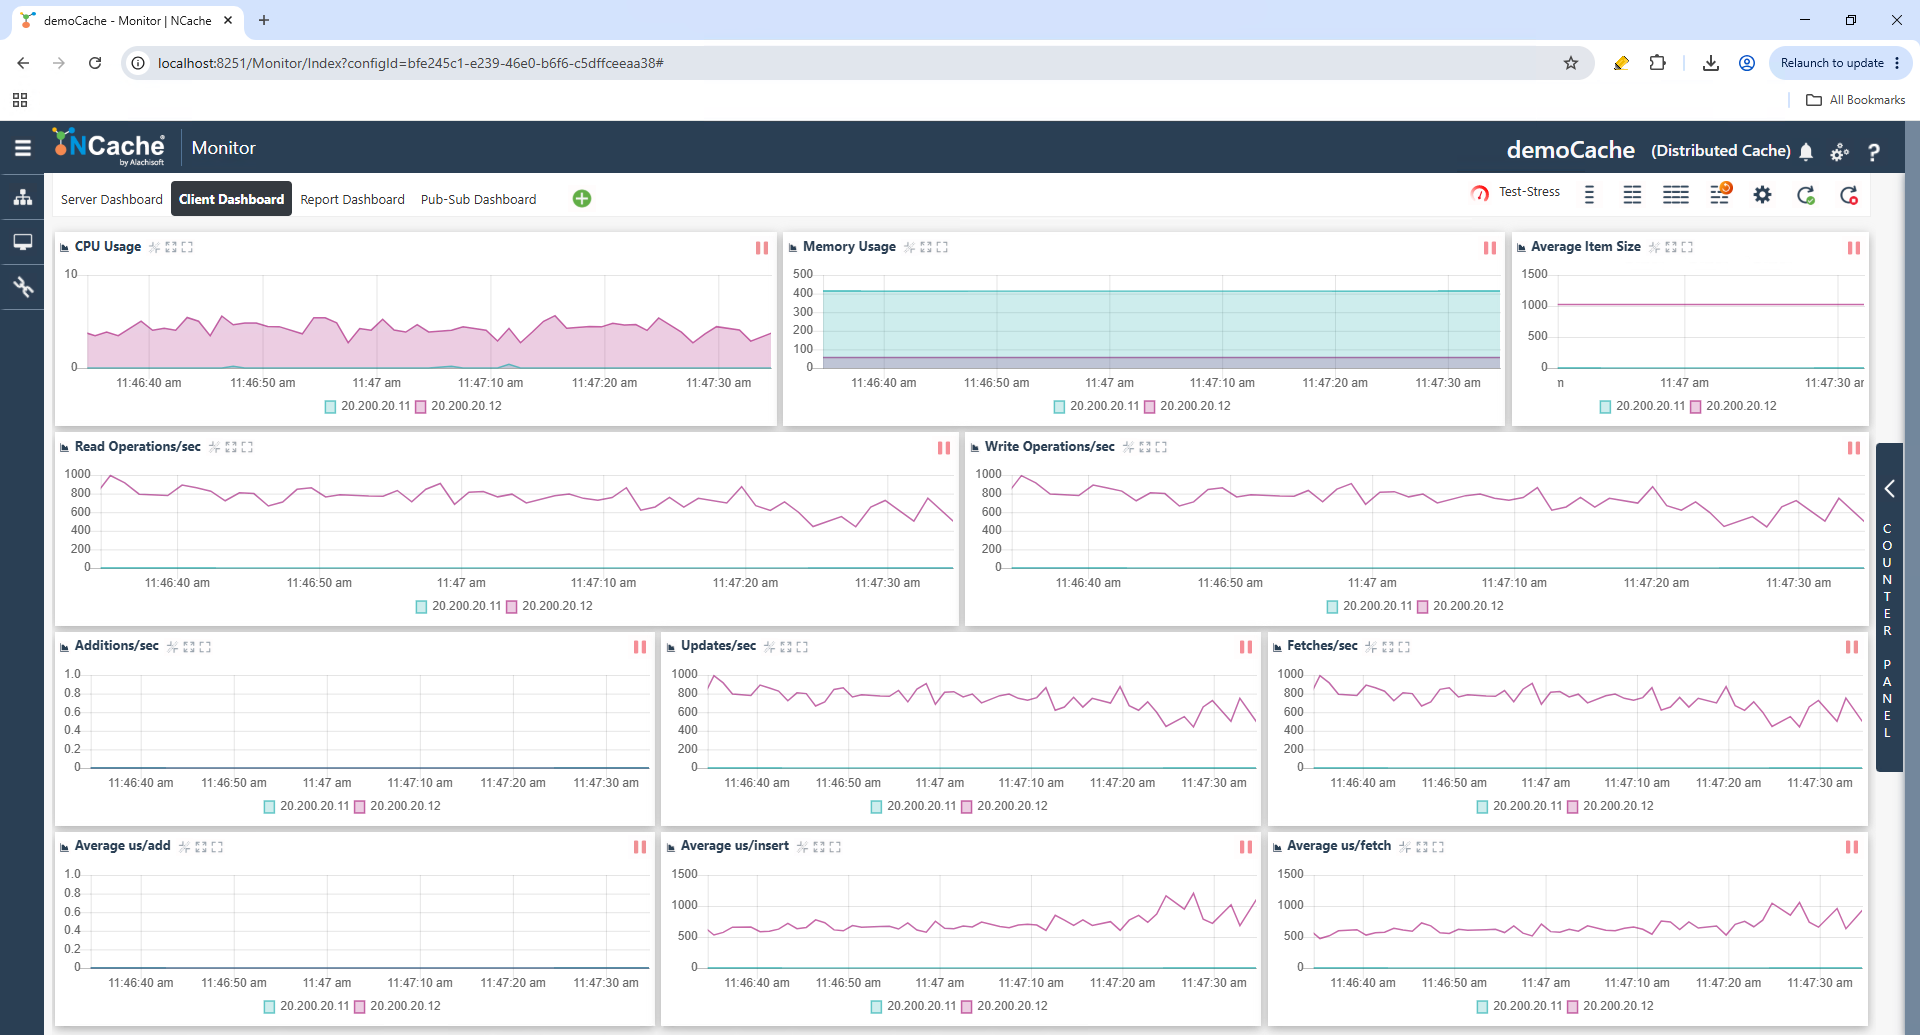
The Client Dashboard page in NCache Management Center provides a graphical view of client-side cache activity and runtime statistics. The dashboard displays live monitoring graphs related to cache operations, resource usage, and client performance metrics.
The dashboard is accessed from the Monitor section by selecting the Client Dashboard tab.
Note
The dashboard navigation tabs and toolbar options behave similarly to those explained in Server Dashboard.
Monitoring Graphs
The dashboard contains multiple graphs displaying client-side runtime counters and performance statistics. Common graphs include:
- CPU Usage: Displays CPU utilization by cache clients.
- Memory Usage: Displays memory consumption by cache clients.
- Average Item Size: Displays the average size of cache items.
- Read Operations/sec: Displays the number of read operations performed per second.
- Write Operations/sec: Displays the number of write operations performed per second.
- Additions/sec: Displays the number of add operations per second.
- Updates/sec: Displays the number of update operations per second.
- Fetches/sec: Displays the number of fetch operations per second.
- Average us/add: Displays average execution time for add operations.
- Average us/insert: Displays average execution time for insert operations.
- Average us/fetch: Displays average execution time for fetch operations.
These graphs display live runtime statistics and update automatically during monitoring.
Counter Panel
The vertical Counter Panel on the right side of the page provides access to additional monitoring counters. The tabs at the top of the panel allow switching between Server and Client counters.
