Server Dashboard
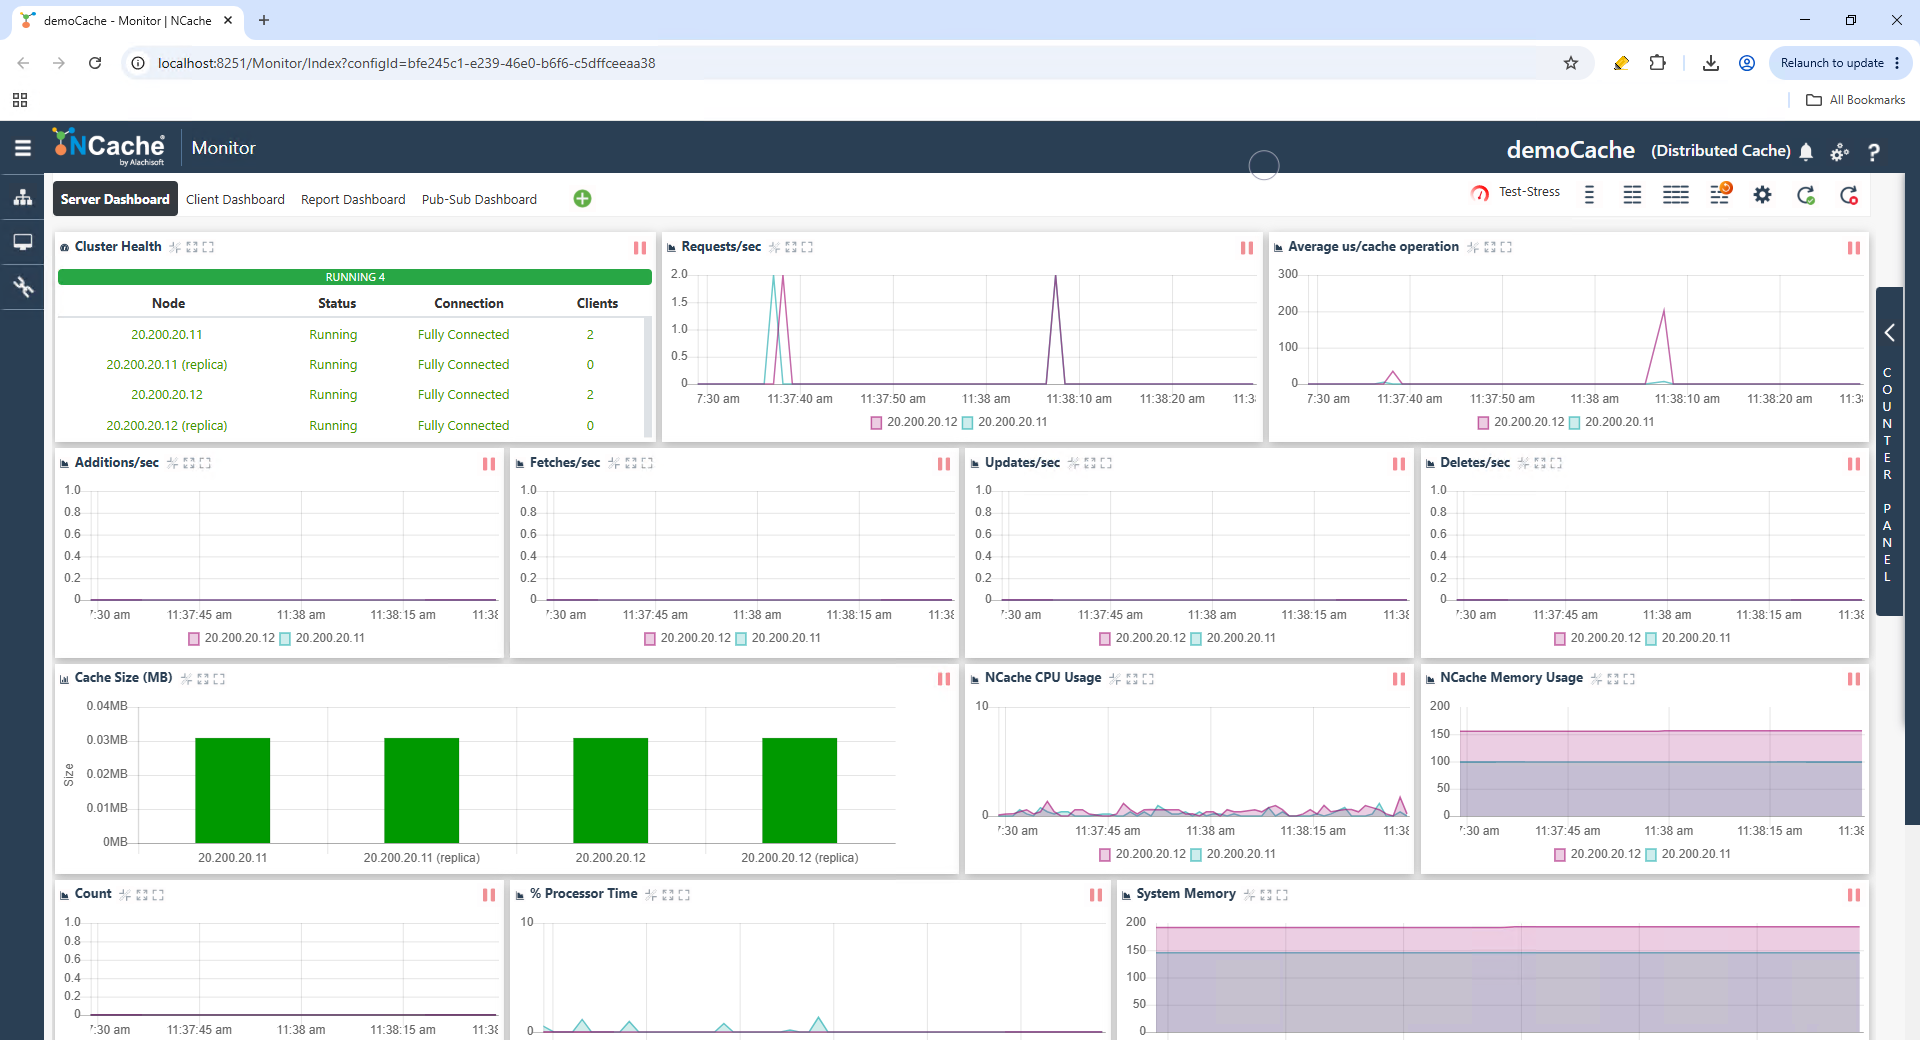
The Server Dashboard page in NCache Management Center provides a real-time graphical view of server-side cache activity, resource utilization, and runtime statistics for the selected cache.
The page is accessed by selecting the cache and clicking on the "..." button against the cache name. Click on Monitor Cluster from the available options.

Or you may click on the  from the toolbar for which you will have to select the checkbox against the cache name.
Dashboard Navigation Tabs
The navigation tabs at the top of the page allow switching between different dashboard views.
- Server Dashboard: Displays server-side cache activity and runtime statistics.
- Client Dashboard: Displays client-side cache activity and client connection statistics.
- Report Dashboard: Displays reporting and summarized cache statistics.
- Pub-Sub Dashboard: Displays monitoring information related to pub-sub messaging.
The + option allows creation of additional custom dashboards.
Cluster Health Table
Cluster Health displays the runtime state of cache nodes in the cluster. The section displays the following information:
- Node: Displays the server node IP address or hostname.
- Status: Displays the runtime state of the node.
- Connection: Displays the connectivity state between cluster nodes.
- Clients: Displays the number of connected cache clients.
It provides a quick overview of cluster availability and connectivity.
Runtime Graphical Statistics
The dashboard contains multiple runtime monitoring graphs for cache activity. Common graphs include:
- Requests/sec: Displays the number of cache requests processed per second.
- Average us/cache operation: Displays the average execution time for cache operations.
- Additions/sec: Displays the number of add operations performed per second.
- Fetches/sec: Displays the number of fetch operations performed per second.
- Updates/sec: Displays the number of update operations performed per second.
- Deletes/sec: Displays the number of delete operations performed per second.
- Cache Size (MB): Displays the current cache memory usage.
- Count: Displays the total number of cache items.
These live graphs are automatically refreshed during monitoring.
System Resource Graphs
The dashboard also displays server resource utilization statistics.
- NCache CPU Usage: Displays CPU utilization by NCache processes.
- NCache Memory Usage: Displays memory consumption by NCache.
- % Processor Time: Displays overall processor utilization.
- System Memory: Displays overall system memory usage.
These graphs help monitor server resource consumption during cache operations.
Client Process
The Client Process section displays information about connected cache clients. It displays details such as:
- Client IP: Displays the IP address of the connected client machine.
- Process ID: Displays the operating system process identifier of the client application.
- Port: Displays the communication port being used by the client.
- Server IP: Displays the cache server node connected to the client.
- Sent Bytes: Displays the amount of data sent from the client.
- Received Bytes: Displays the amount of data received by the client.
This section provides visibility into client-server communication activity.
Event Logs
The Event Logs section displays runtime events generated by cache servers. The section includes:
- Type: Displays the event category such as Information, Warning, or Error.
- Node: Displays the server node that generated the event.
- Date: Displays the event generation date.
- Time: Displays the event generation time.
- Event: Displays the event name or category.
- Source: Displays the source component generating the event.
- Message: Displays the detailed event description.
This section helps monitor runtime events and operational messages.
Counter Panel
The vertical Counter Panel on the right side of the page provides access to additional monitoring counters. The tabs at the top of the panel allow switching between Server and Client counters.
