Custom Dashboard
The Custom Dashboard page in NCache Management Center allows monitoring of selected cache counters in a customized dashboard view. A custom dashboard can be created for different cache store types and can display server-side or client-side counters based on monitoring requirements.
Dashboard Creation View
The Dashboard Creation view appears when a new dashboard is added from the Monitor page. It provides fields for defining the dashboard name and selecting the dashboard view type.
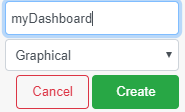
The Dashboard Name field specifies the name of the custom dashboard. The View option defines how counters are displayed, such as Graphical or Report view.
Custom Dashboard View
The Custom Dashboard view displays the counters added by the user. The dashboard area remains empty until counters are added from the Counter Panel.
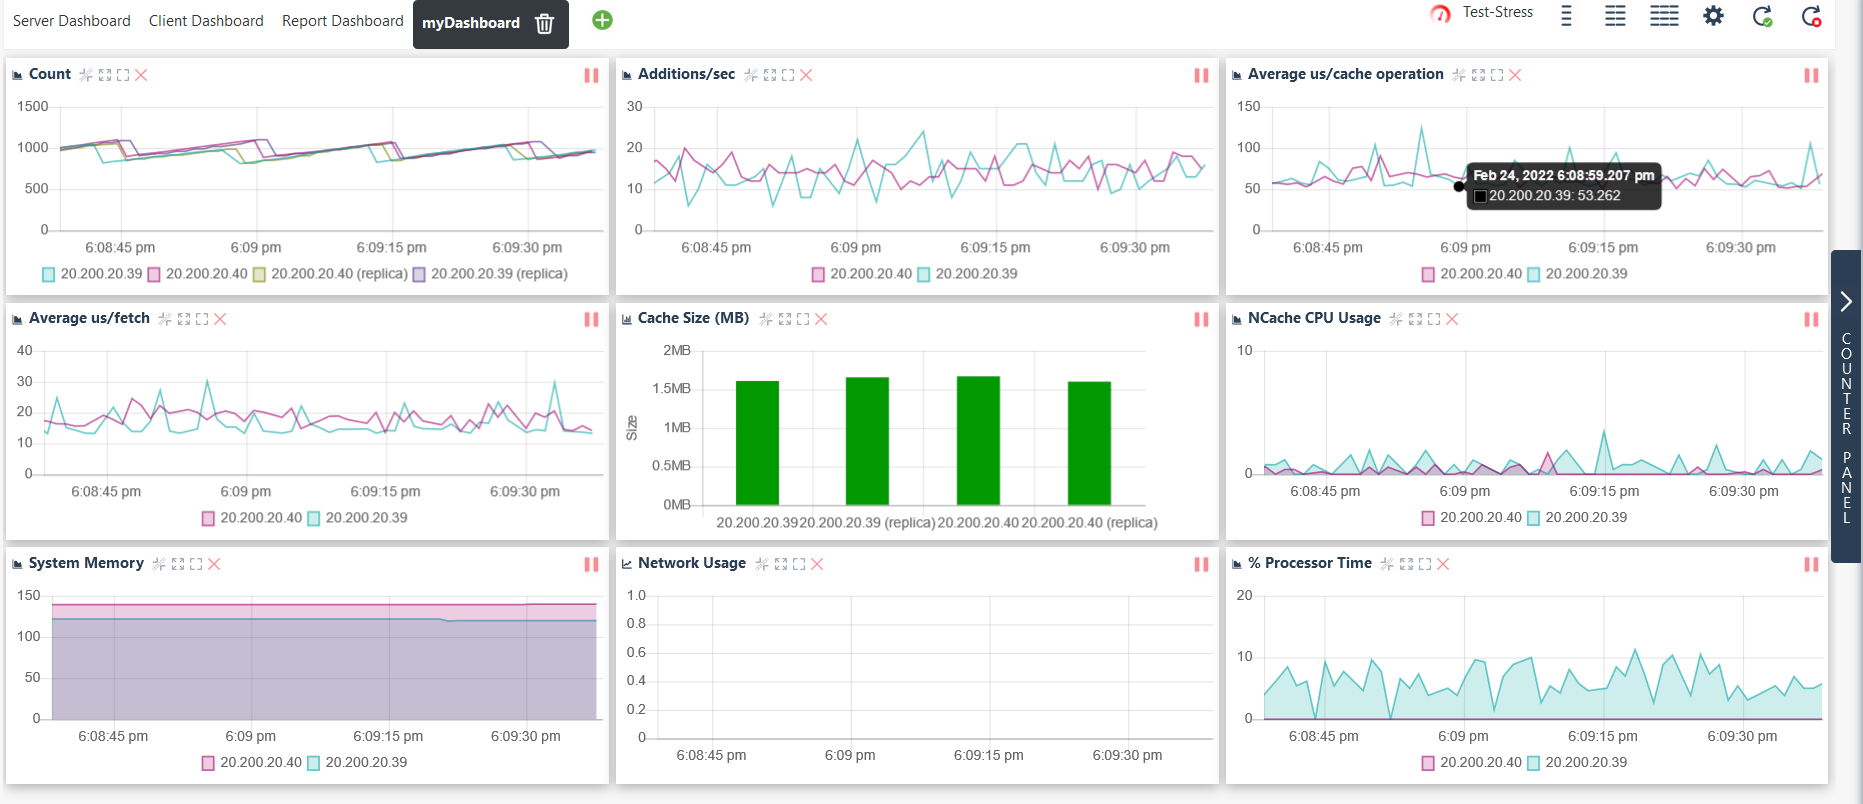
Counters are added to the dashboard by dragging and dropping them from the Counter Panel onto the dashboard area. Added counters can display server statistics, client statistics, cache health information, resource usage, and other runtime monitoring data.
Counter Panel
The Counter Panel is available on the right side of the dashboard. It provides categorized counters that can be added to the custom dashboard.
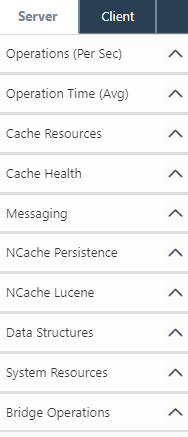
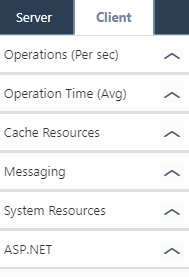
The Server and Client tabs in the Counter Panel provide categorized monitoring counters that can be added to the dashboard for runtime monitoring.
The Server tab contains counters related to cache server activity, cluster health, server resources, indexing, data structures, messaging, and bridge operations. Available server counter categories include:
- Operations (Per sec): Displays counters related to cache operation throughput such as requests, additions, updates, fetches, deletes per second, etc.
- Operation Time (Avg): Displays average execution time for cache operations.
- Cache Resources: Displays counters related to cache size, item count, and memory consumption.
- Cache Health: Displays counters related to node status, connectivity, and cluster health.
- Messaging: Displays counters related to Pub/Sub messaging operations and message delivery.
- Data Structures: Displays counters related to distributed data structures supported by NCache.
- System Resources: Displays system-level counters such as CPU and memory usage.
- Bridge Operations: Displays counters related to bridge replication and multi-site replication activity.
The Client tab contains counters related to client-side cache activity and application resource utilization. Available client counter categories include:
- Operations (Per sec): Displays client-side cache operation throughput.
- Operation Time (Avg): Displays average execution time for client-side cache operations.
- Cache Resources: Displays counters related to average item size, compressed item size, and request queue usage on the cache client.
- Messaging: Displays counters related to client-side Pub/Sub messaging activity.
- System Resources: Displays client machine resource utilization such as CPU and memory usage.
- ASP.NET: Displays counters related to ASP.NET cache client activity and application performance.
See Also
Server Dashboard
Client Dashboard
Report Dashboard
Pub-Sub Dashboard
