Statistics
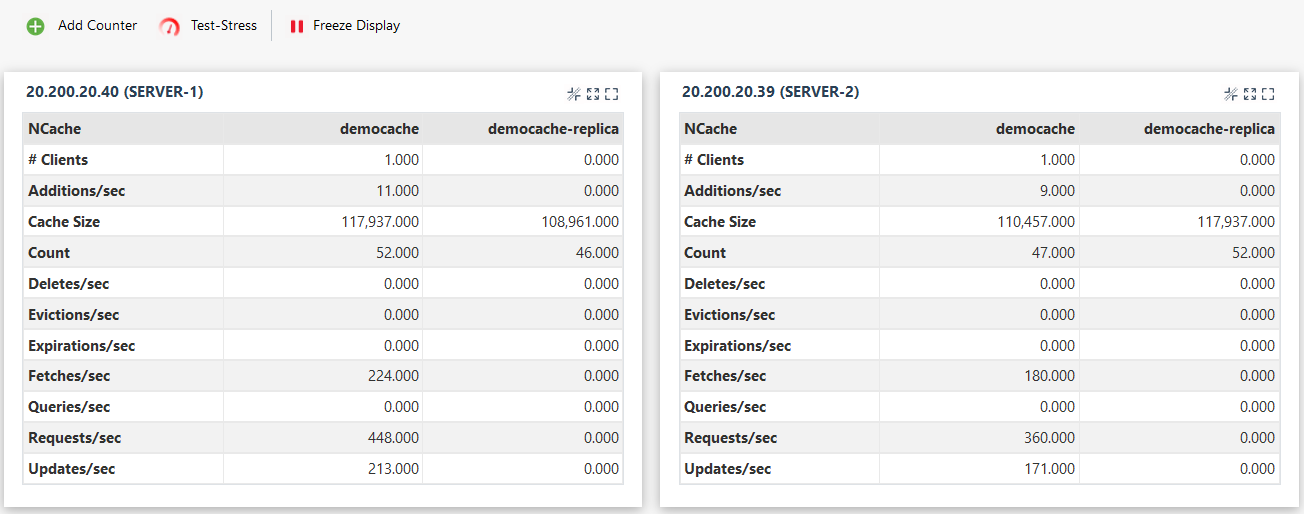
The Statistics page in NCache Management Center displays runtime statistics and performance counters for the selected cache. This page provides a live view of cache activity across cache nodes and replicas.
The page is accessed by selecting the cache and clicking on the "..." button against the cache name. Click on Show statistics from the available options.

Or you may click on the  from the toolbar for which you will have to select the checkbox against the cache name.
Toolbar
The toolbar at the top of the page provides options related to statistics monitoring and display management.
| Button | Description |
|---|---|
| Add Counter | Adds additional counters or monitoring widgets to the statistics view. |
| Test-Stress | Opens the stress testing utility for generating cache activity and monitoring runtime behavior. |
| Freeze Display | Pauses the live statistics refresh so the currently displayed values remain unchanged. |
Runtime Counters
The statistics table displays commonly used cache counters including:
- # Clients: Displays the number of connected cache clients.
- Additions/sec: Displays the number of add operations performed per second.
- Cache Size: Displays the current cache memory consumption.
- Count: Displays the total number of cache items.
- Deletes/sec: Displays the number of delete operations performed per second.
- Evictions/sec: Displays the number of eviction operations per second.
- Expirations/sec: Displays the number of item expiration operations per second.
- Fetches/sec: Displays the number of fetch operations per second.
- Queries/sec: Displays the number of query operations executed per second.
- Requests/sec: Displays the total number of cache requests per second.
- Updates/sec: Displays the number of update operations performed per second.
