Report Dashboard
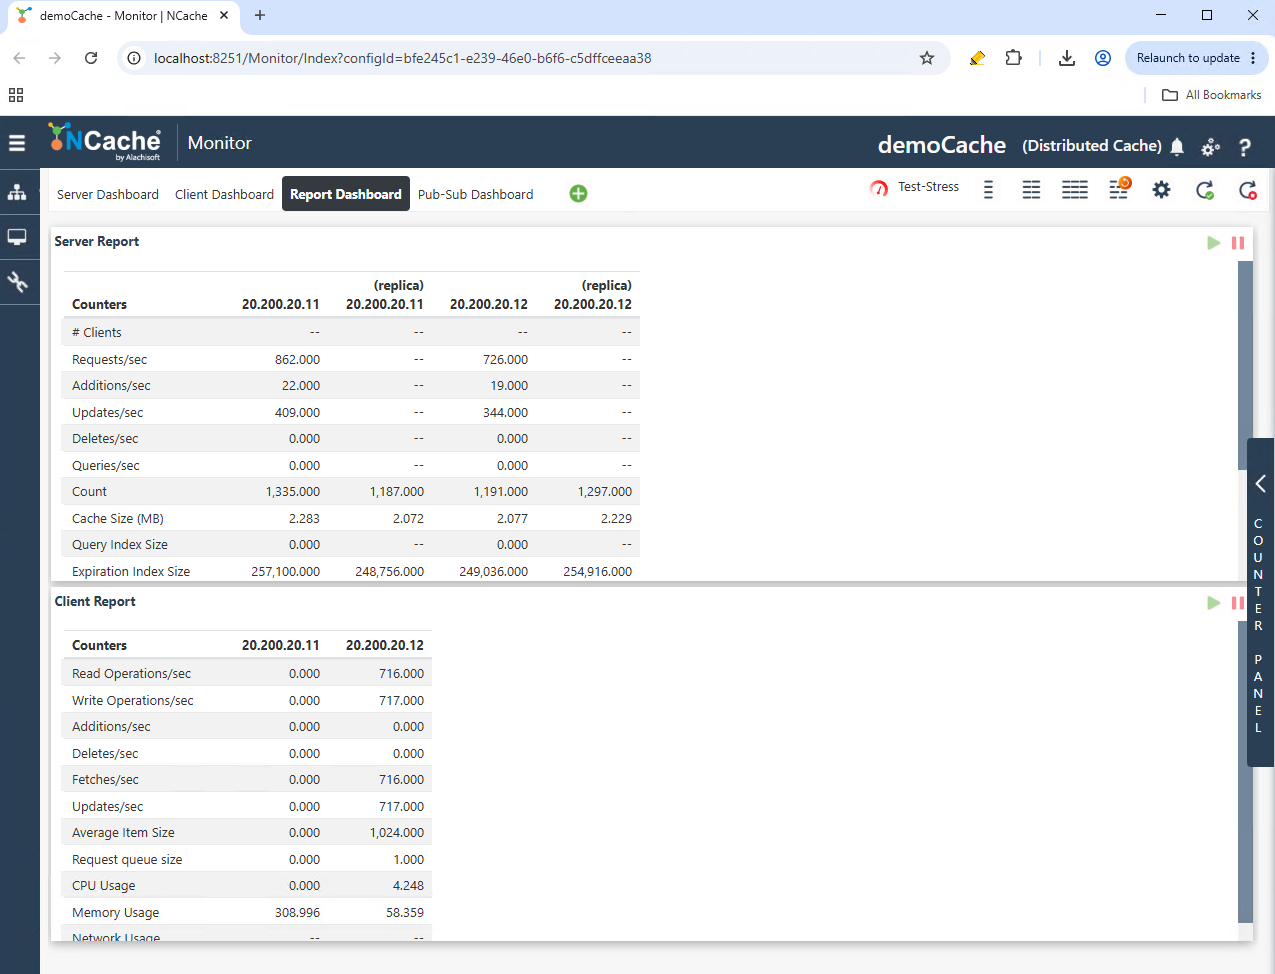
The Report Dashboard page in NCache Management Center provides a summarized tabular view of cache statistics and runtime counters. The dashboard displays both server-side and client-side reports for the selected cache.
The dashboard is accessed from the Monitor section by selecting the Report Dashboard tab.
Note
The dashboard navigation tabs and toolbar options behave similarly to those explained in Server Dashboard.
Server Report
The Server Report section displays summarized runtime statistics for cache server nodes and replica nodes. The report displays counters such as:
- # Clients: Displays the number of connected cache clients.
- Requests/sec: Displays the number of cache requests processed per second.
- Additions/sec: Displays the number of add operations performed per second.
- Updates/sec: Displays the number of update operations performed per second.
- Deletes/sec: Displays the number of delete operations performed per second.
- Queries/sec: Displays the number of query operations performed per second.
- Count: Displays the total number of items currently stored in cache.
- Cache Size (MB): Displays the memory consumed by cached items.
- Query Index Size: Displays memory used by query indexes.
- Expiration Index Size: Displays memory used for expiration tracking indexes.
- Eviction Index Size: Displays memory used for eviction management indexes.
- Message Store Size: Displays memory used for stored messaging data.
- Messages Count: Displays the total number of stored messages.
- NCache CPU Usage: Displays CPU utilization by NCache processes.
- NCache Memory Usage: Displays memory consumption by NCache services.
- Network Usage: Displays network traffic generated by cache operations.
The columns display statistics for cache nodes and replica nodes separately.
Client Report
The Client Report section displays summarized client-side runtime counters. Available counters include:
- Read Operations/sec: Displays the number of read operations performed per second.
- Write Operations/sec: Displays the number of write operations performed per second.
- Additions/sec: Displays the number of add operations performed per second.
- Deletes/sec: Displays the number of delete operations performed per second.
- Fetches/sec: Displays the number of fetch operations performed per second.
- Updates/sec: Displays the number of update operations performed per second.
- Average Item Size: Displays the average size of cached items.
- Request Queue Size: Displays the number of pending client requests waiting for processing.
- CPU Usage: Displays CPU utilization by cache clients.
- Memory Usage: Displays memory consumption by cache clients.
- Network Usage: Displays network traffic generated by client operations.
These counters provide visibility into client-side cache activity and resource utilization.
Counter Panel
The vertical Counter Panel on the right side of the page provides access to additional monitoring counters. The tabs at the top of the panel allow switching between Server and Client counters.
See Also
Server Dashboard
Client Dashboard
Pub/Sub Dashboard
Statistics
