Pub-Sub Dashboard
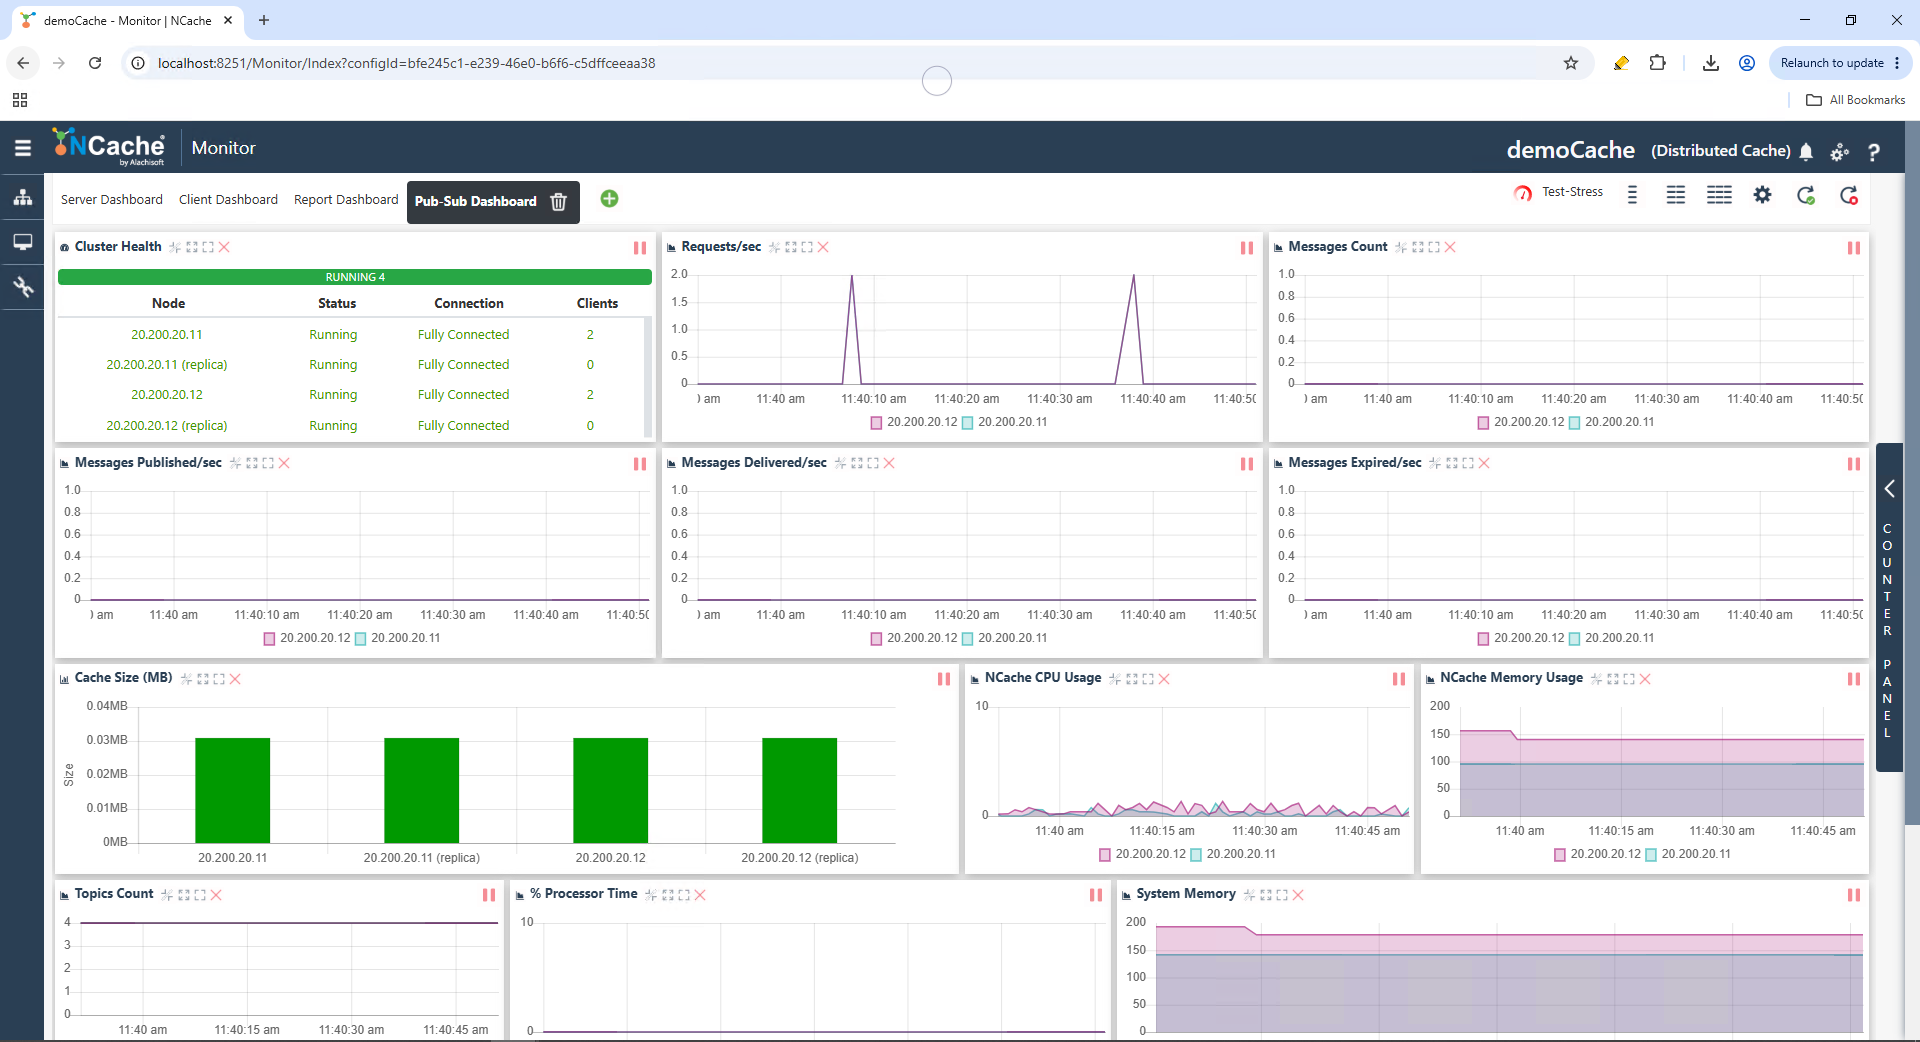
The Pub-Sub Dashboard page in NCache Management Center provides monitoring and visualization for pub-sub messaging activity within the cache cluster. This dashboard displays runtime statistics related to topics, published messages, delivered messages, and cache resource utilization.
The dashboard is accessed from the Monitor section by selecting the Pub-Sub Dashboard tab.
Note
The dashboard navigation tabs and toolbar options behave similarly to those explained in Server Dashboard.
Cluster Health
The Cluster Health section displays the runtime status of all cache nodes participating in the cluster. The section displays:
- Node: Displays the server node IP address or hostname.
- Status: Displays the runtime state of the node.
- Connection: Displays the connectivity state between cluster nodes.
- Clients: Displays the number of connected cache clients.
This section helps monitor node availability and cluster connectivity.
Pub-Sub Messaging Counters
The dashboard includes multiple monitoring graphs that display pub-sub messaging and cache request statistics.
- Requests/sec: Displays the total number of cache requests processed per second.
Available Pub/Sub messaging counters include:
Messages Count: Displays the total number of messages handled by all Topics. This counter is at the node level for Partitioned caches.
Messages Published/sec: Displays the number of messages published per second.
Messages Delivered/sec: Displays the number of messages delivered to subscribers per second.
Messages Expired/sec: Displays the number of expired messages per second.
Topics Count: Displays the total number of active Topics in the cache.
These counters help monitor messaging throughput, topic activity, and delivery performance.
Cache Resource Counters
The dashboard also displays cache resource utilization counters for monitoring server performance. Available counters include:
- Cache Size (MB): Displays the size of the cache in MB, including the cache store meta information and all other indices.
- NCache CPU Usage: Displays CPU utilization by NCache processes.
- NCache Memory Usage: Displays memory consumption by NCache services.
- % Processor Time: Displays overall processor utilization on the server machine.
- System Memory: Displays overall system memory utilization.
These counters provide visibility into resource consumption during Pub-Sub activity.
Client Process
The Client Process section displays information about connected client applications. This section provides details such as:
- Client IP: Displays the IP address of the connected client.
- Process ID: Displays the process identifier of the client application.
- Port: Displays the communication port used by the client.
- Server IP: Displays the cache server connected to the client.
- Sent Bytes: Displays the amount of data sent by the client.
- Received Bytes: Displays the amount of data received by the client.
This helps monitor active client connections and communication statistics.
Event Logs
The Event Logs section displays runtime events generated by cache servers. The section includes:
- Type: Displays the event category such as Information, Warning, or Error.
- Node: Displays the server node that generated the event.
- Date: Displays the event generation date.
- Time: Displays the event generation time.
- Event: Displays the event name or category.
- Source: Displays the source component generating the event.
- Message: Displays the detailed event description.
This section helps administrators review warnings, informational events, and operational messages related to Pub-Sub activity.
Counter Panel
The vertical Counter Panel on the right side of the page provides access to additional monitoring counters and graphs. The tabs at the top of the panel allow switching between Server and Client counters.
See Also
Server Dashboard
Client Dashboard
Report Dashboard
Statistics
Custom Dashboard
