Monitor
NCache Management Center provides monitoring pages for viewing cache statistics, runtime counters, dashboard graphs, client activity, server health, pub-sub messaging, and custom monitoring views. These pages help observe cache behavior and resource usage in real time.
In This Section
Statistics
The Statistics page displays runtime cache statistics and counter values for the selected cache.
Server Dashboard
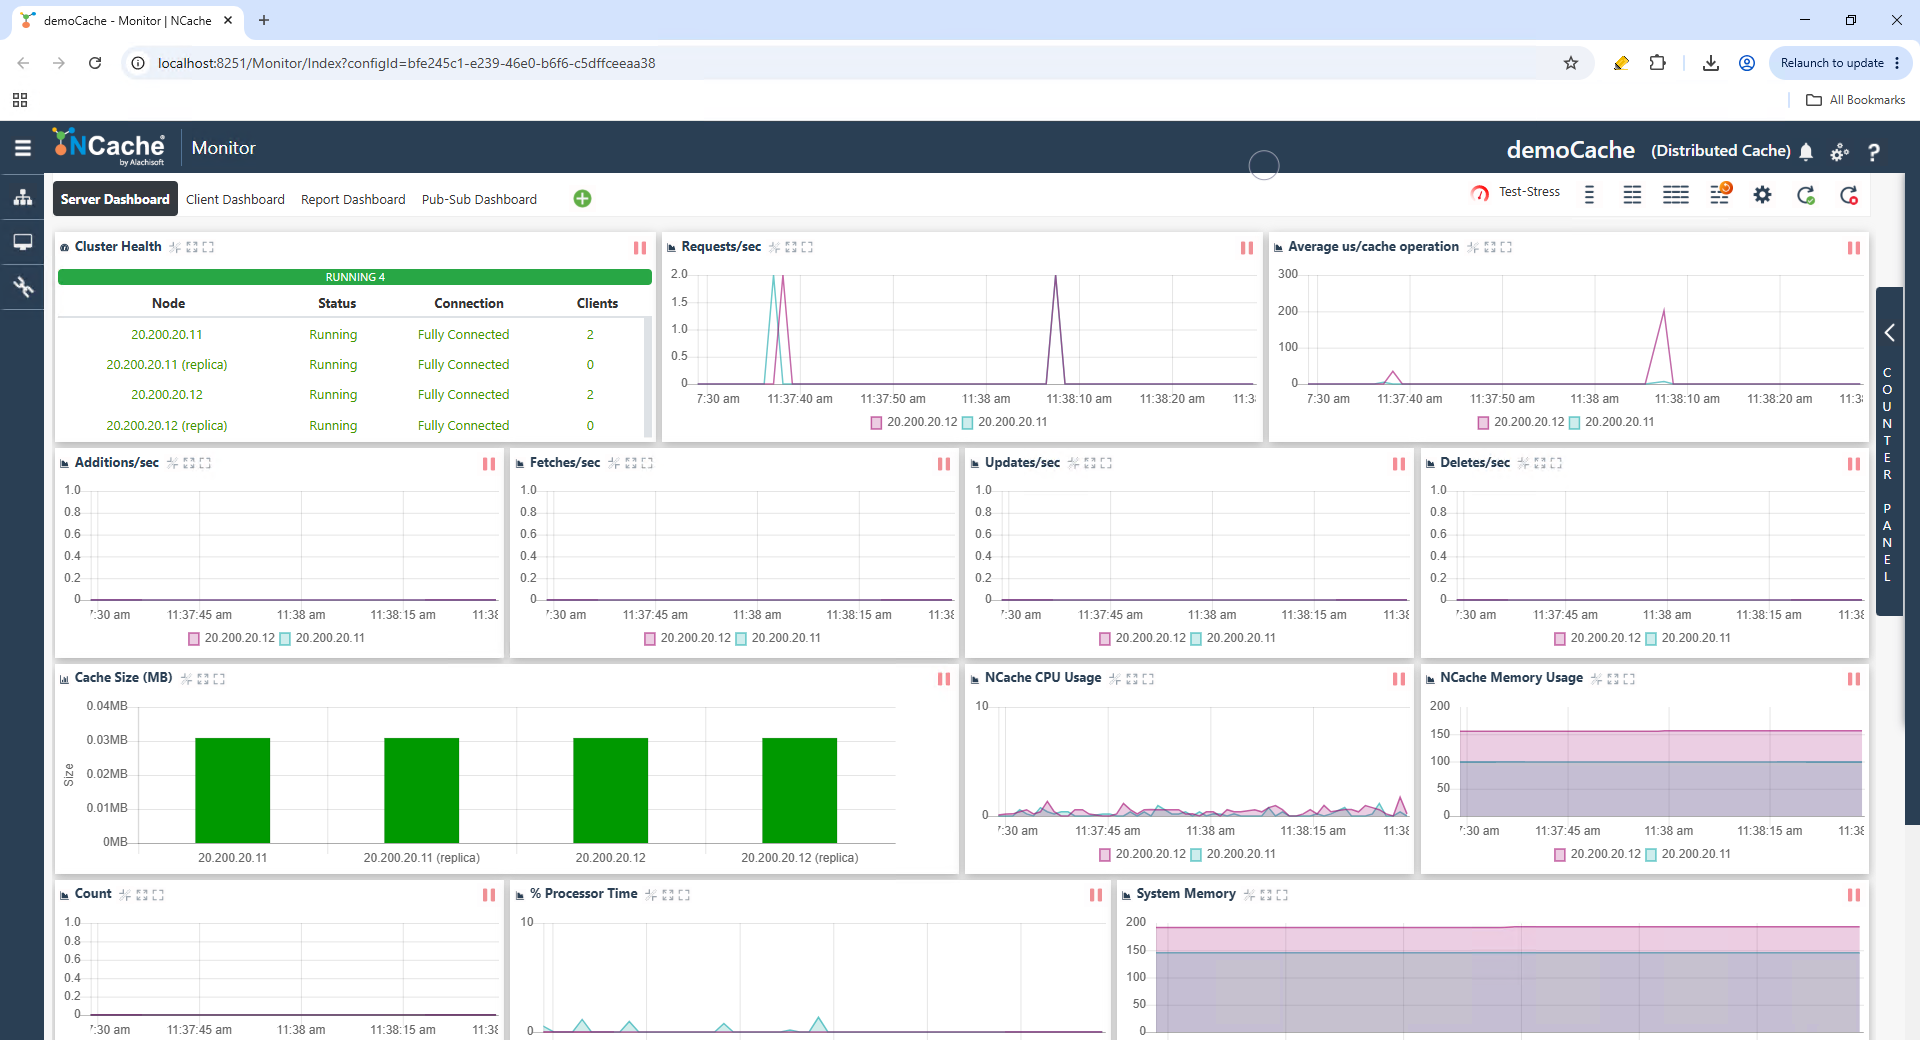
The Server Dashboard page provides a real-time graphical view of server-side cache activity, cluster health, resource utilization, and runtime statistics.
Client Dashboard
The Client Dashboard page displays client-side cache activity, operation counters, resource usage, and performance metrics.
Report Dashboard
The Report Dashboard page provides summarized tabular reports for server-side and client-side cache statistics.
Pub-Sub Dashboard
The Pub-Sub Dashboard page displays runtime counters and graphs related to publish-subscribe messaging activity.
Custom Dashboard
The Custom Dashboard page allows creating customized monitoring views by adding selected server-side and client-side counters from the Counter Panel.
