NCache Performance Benchmarks
2 Million Ops/Sec
(5 Node Cluster)
Checkout performance results of NCache in distributed environments. These tests were conducted in Amazon AWS environment.
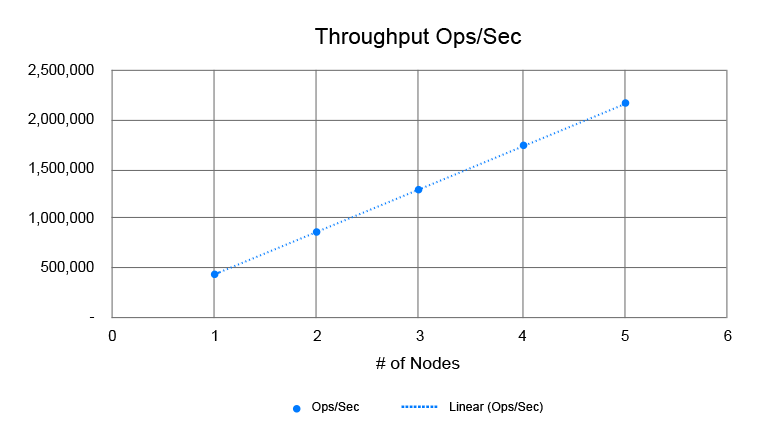
In our latest benchmarks, we have successfully demonstrated that NCache can linearly scale and achieve 2 Million transactions per second with only a 5-server cache cluster. NCache delivers this performance with sub-microsecond latency. The scalability is linear which means that if you add more cache servers, NCache will deliver higher transaction throughput.
NCache Benchmark Graphs
Watch the actual benchmarking video so you can see how these benchmarks were done.
In this video we going to talk about NCache performance benchmarking numbers. NCache is an extremely fast and scalable In-Memory Distributed Caching system for your .NET and .NET Core applications and today we will achieve 2 Million Operations per second and, at the same time maintaining less than 3 Microseconds latency per operation, with just 5 NCache Servers.
NCache is linearly scalable beyond this point, meaning you can add as many servers as you need to, and while you would add more servers, you would get more request handling capacity, out of your Cache Cluster and that too in a linear fashion.
Benchmark Setup
Let's review our benchmark setup. I'm using ‘AWS m4. 10xlarge’ Servers for my test. I have five of these NCache Servers, on which I have my Cache Cluster configured and I have 15 Client Servers, from where I would run my applications and connect to this cache cluster.
Hardware Configuration
-
AWS m4.10xlarge
(40 Cores, 160 GB RAM, 10 Gbps Ethernet) -
5 NCache Servers
-
15 Client Servers
2 App instances/Server
Software Configuration
-
Windows Server 2016
Data Center Edition - x64 -
NCache Enterprise 5.0
-
NCache Partitioned Cache
Pipelining Enabled
Load Configuration
-
1 Million Total Items
Byte array of size 100 each -
80:20 Get, Update Ratio
-
4 GB Cache Size / Server
30 App Instances connected
I am using Windows Server 2016 as Operating System, Data Center Edition 64-bit. NCache version is 5.0 Enterprise and I'm using NCache Partitioned Cache, as a caching topology.
Caching Topology
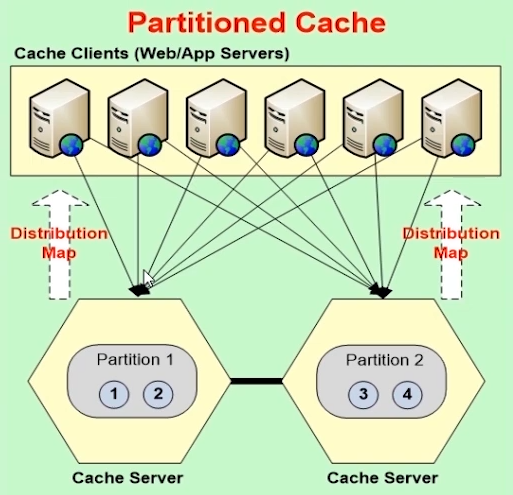
It is the architectural diagram of this topology, where we have data fully distributed in partitions, on all Caching Servers and Clients connect to all Servers for Read and Write requests. They fully utilize all Servers in that too at the same time. We don't have replication turned on for this topology but there are other topologies, such as Partitioned Replica Cache, which also comes equipped with replication support.
Benchmark Environment Configuration
I have Pipelining Enabled. That's a new feature in NCache version 5.0. It works in such a way that, on the Client-side it accumulates all requests which are happening at runtime and it applies those requests at once on the Server-side and accumulation is done within Microseconds. So, it's very optimized and it's very recommended setup or configuration when you have high transactional load requirements.
Hardware Configuration
-
AWS m4.10xlarge
(40 Cores, 160 GB RAM, 10 Gbps Ethernet) -
5 NCache Servers
-
15 Client Servers
2 App instances/Server
Software Configuration
-
Windows Server 2016
Data Center Edition - x64 -
NCache Enterprise 5.0
-
NCache Partitioned Cache
Pipelining Enabled
Load Configuration
-
1 Million Total Items
Byte array of size 100 each -
80:20 Get, Update Ratio
-
4 GB Cache Size / Server
30 App Instances connected
As far as load configurations are concerned, we are using 1 Million total items, which are going to be added in the cache and then will, you know, simulate Read and Write request load with a ratio of 80% Reads and 20% Writes on the cache. And, we have Byte array of 100 each, as individual item in the Cache. I have 4GB cache size per server and we have total of 30 application instances, which are going to connect to the cache.
Data Population
So, without any delays, I'm going to get started with 'Data Population' of 1 Million items in my Cache Cluster. Now, this is our demo environment. We have 5 NCache servers, as discussed earlier on. At the moment there is no activity but I'm going to simulate a client application which is going to connect and add 1 Million items in the cache.
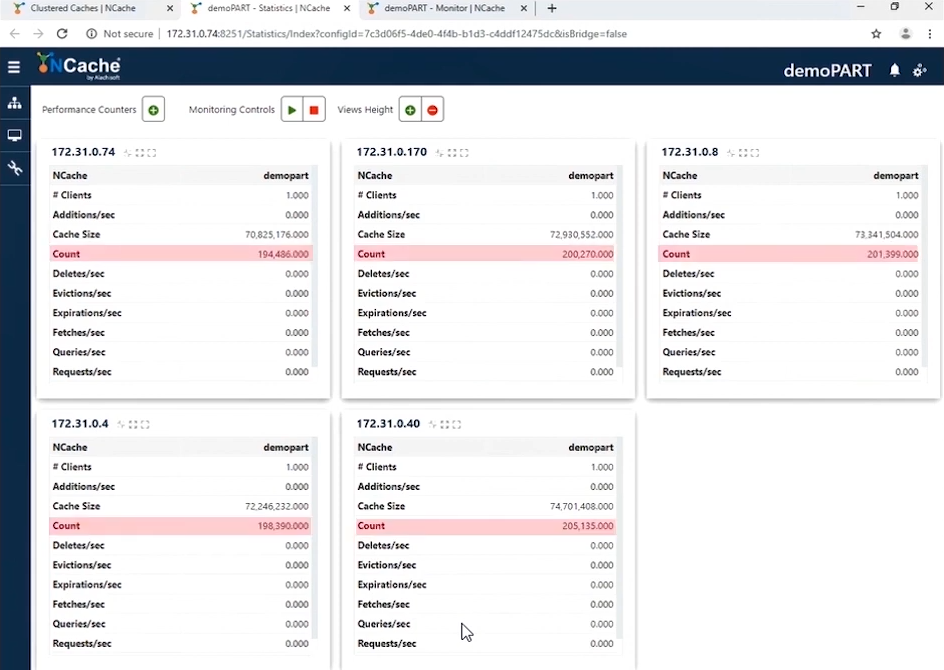
So, I have run the application and you would see 1 client being connected on all caching servers and we have activity on additions per second counter on all servers. Cache size is going up and count counter is also going up and requests per second is a total number of requests per second. And, there you go, 1 million items are already added in the cache cluster. I can now, you know, get started with read and write request load, and if I quickly show you the monitoring details, you can see blip in, you know, increase in CPU, in memory, additions per second and requests per second and also in the count counter as well and cache size has also gone up.
Build Transactional Load
I will now run the application to build some transactional load on this cache cluster, with 80% Reads and 20% Writes operation. So, let's quickly do that. And, you would start seeing activity on all, you know, cache servers in PerfMon counters.
1 Million Requests / Second
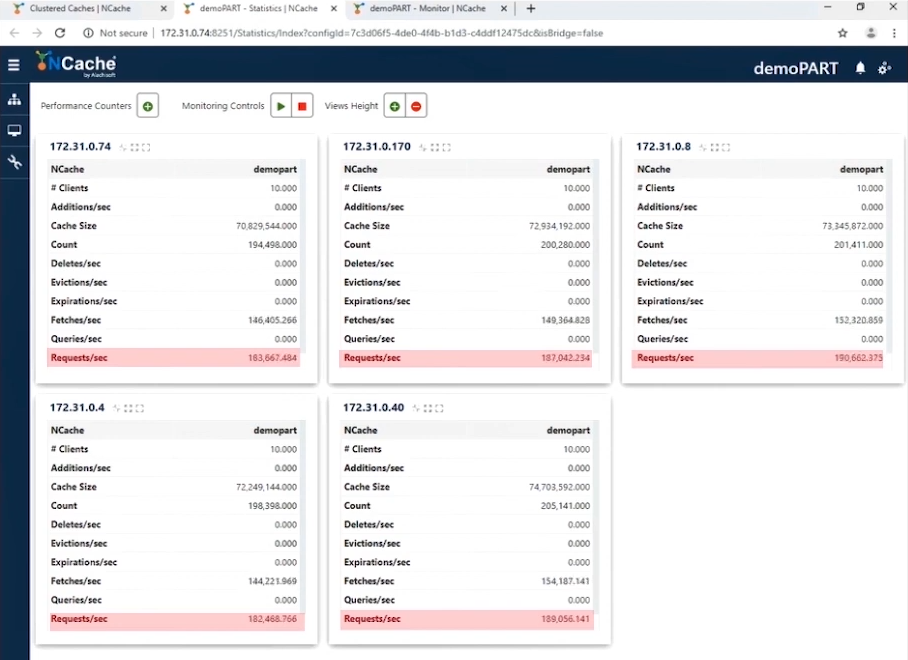
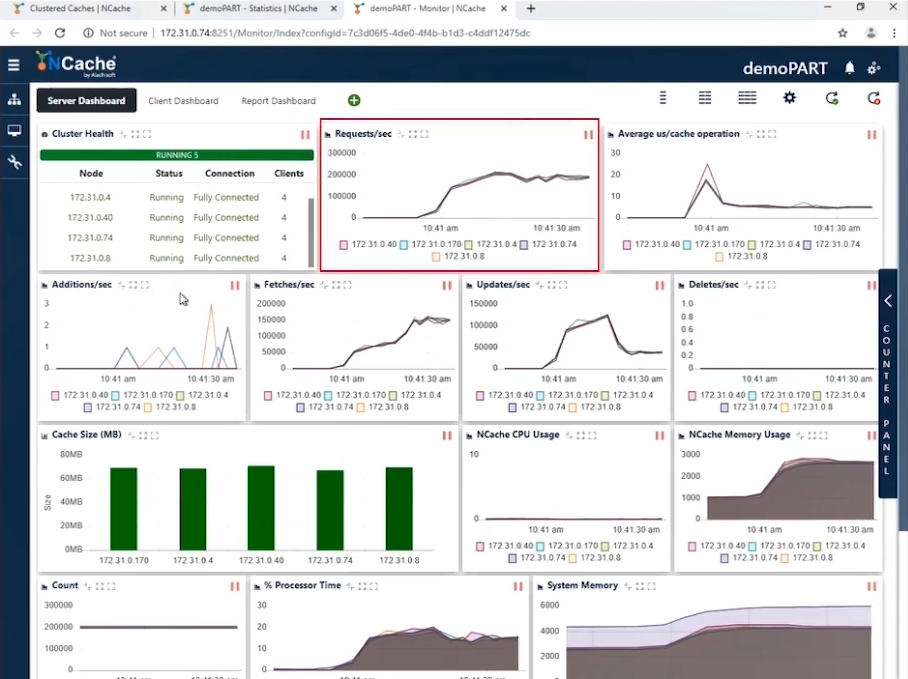
You can see number of clients’ counters showing about 10 clients, you know, instances connected to each NCache server, with activity on Fetches as well as on Updates per second, and Requests per second counter is, somewhere between 180,000 to 190,000 requests per second. And, since we have 5 NCache servers, which are working in parallel, so, accumulating these requests brings us, you know, 1 Million requests per second by this cache cluster, and you can see pretty consistent data distribution.
Web Monitoring stats are pretty healthy, with, you know, System Memory and CPU, pretty low, with Fetches per second and Requests per sec, showing 200,000 Requests per second, around 150,000 per second Fetches. Updates are 50,000 Updates per second. And, average Microsecond per cache operation is little less than 10 Microsecond per operation. And, that's the best thing about this Cache Cluster, where it's In-Memory and it ensure that you have low latency and high throughput from your NCache Cache Cluster.
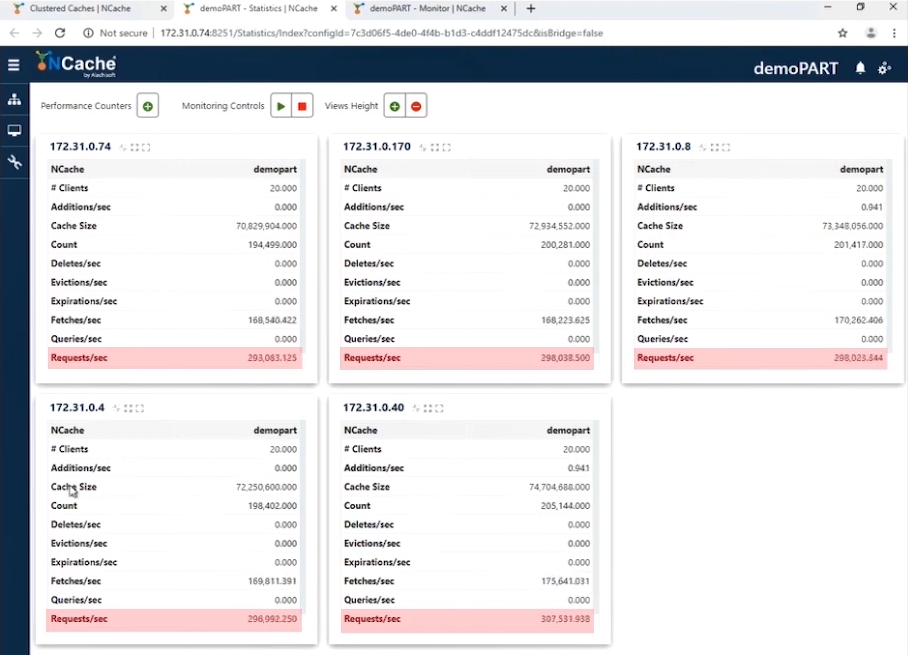
Our stage one is completed where we have successfully achieved 1 Million Operations per second from our Cache Cluster. I have a screenshot for a reference, where, we have 200,000 Requests per second by each NCache Server and we have 5 of these NCache Servers, while maintaining less than 10 Microseconds per Cache operational latency as well.
So, it’s pretty fast per operation, and we have a pretty consistent mix of fetches as well as updates per second, to exhibit a real-life application scenario, and at the same time we have a very efficient utilization of CPU and memory, where we have very less utilization for these resources, for this particular test.
1.5 Million Requests / Sec
Now that we have achieved 1 Million requests per second, it's time to bump up the load. So, I would run some more application instances, to increase transactional load, and as soon as these applications would run, you would see increase in Requests per second counter.
First of all you can notice number of Clients to be 20. 20 instances which are connected to all NCache Servers and we have Requests per second counter now showing 300,000 Requests per second by each NCache Server, and we have successfully achieved 1.5 Million requests per second, from this cache cluster.
Let me quickly show you the Web Monitoring tool, for performance stats. You can see Requests per second by each Server, 300,000 Requests per second. Fetches are little over 200,000 Fetches per sec and Updates are between 50,000 and 100,000. And you can see average Microsecond per cache operation less than 4 Microsecond, that's amazing because we have very low latency and this is an impact of 'Pipelining'. When you have high transactional load from the client end, pipelining really helps and reduces latency increases throughput. And then this is why, we can recommend this to be turned on.
Our stage two is now completed, where we have achieved 1.5 Million Operations per second from our Cache Cluster. Here is a screenshot for this result.
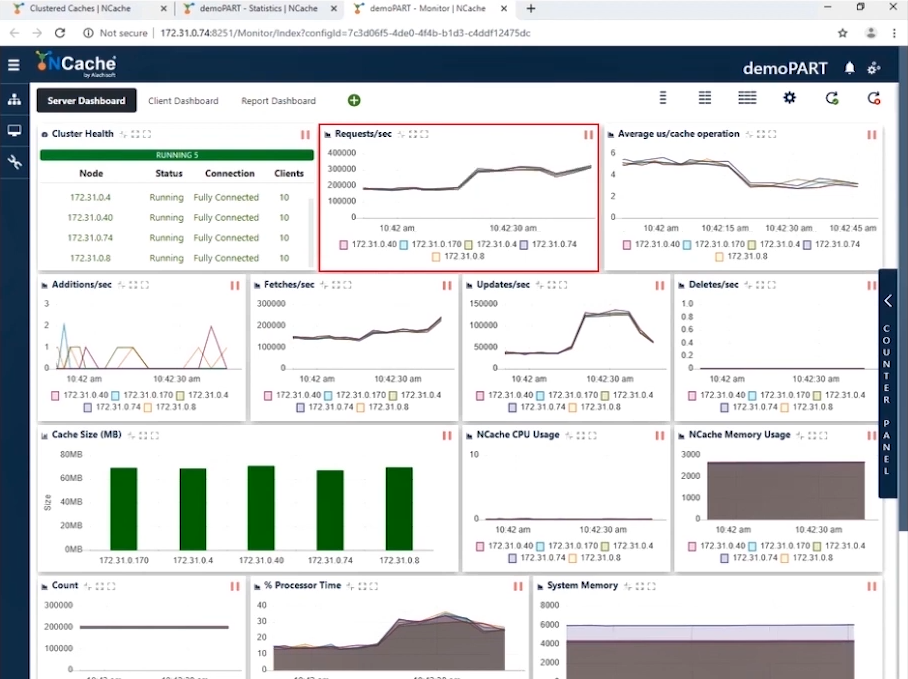
We now have 300,000 Requests per second by each NCache Server. So, that has been increased, and our latency has decreased. We have averaged Microsecond per cache operation, now taking somewhere around 3 to 4 Microseconds per cache operation. So, that's a huge improvement, and, we again, have pretty mix of Fetches and Updates and again maintaining less utilization of CPU as well as memory. So, our Servers are not being maxed out at this point. I want to clarify that you can further stretch load, which we'll do next.
2 Million Requests / Sec
After achieving 1.5 Million Requests per second, I would not stop here. Let's further bump up the load, and let's see how NCache Cache Cluster behaves as a result of that. So, I'm running some more application instances, and you would see a further increase in Requests per second counter. You can see 30 Clients, you know, instances are now connected to all NCache Servers and we're already seeing an increase in Requests per second counter.

You can now see, we have successfully touched 400,000 Requests per second by each NCache Server. And we have 5 NCache Servers, so, that makes a total of 2 Million Requests per second by this NCache Cache Cluster. So, by increasing transaction load from Client-end you can clearly see, NCache has achieved 2 Million Requests per second. And we have average Microsecond per Cache operation less than 3 Microseconds and we also have system Memory and Processor time, you know, CPU well under limits, where I we have 40% to 50% utilization, on both fronts.
As you can now see, we have successfully achieved 2 Million Operations per second. So, let's review these results with the help of a screenshot.
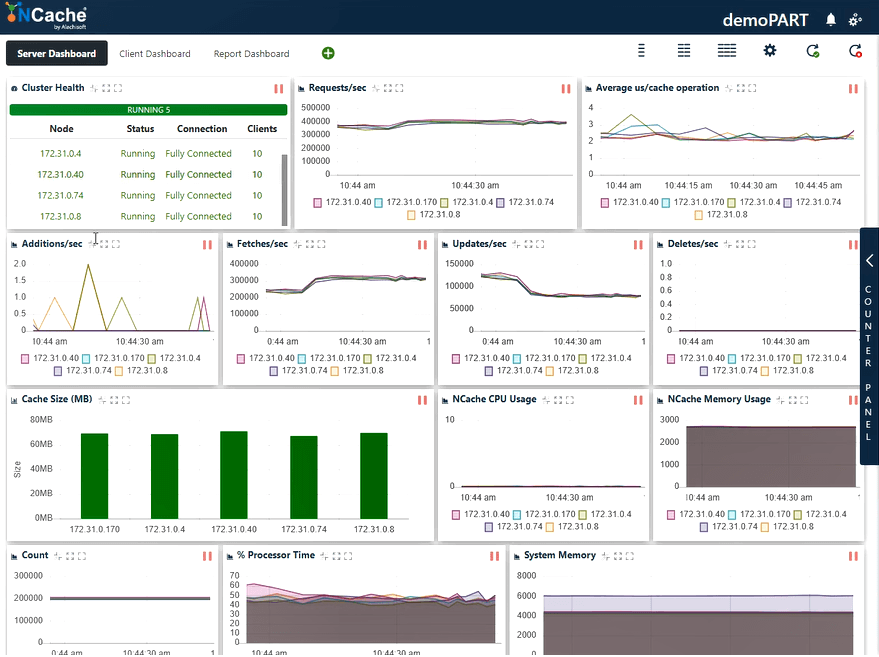
We now have 400,000 Requests per second by each NCache Server, that makes total of 2 Million Requests per sec and nice thing is that latency has further drop down. We now have 2 to 3 Microseconds per Cache operation latency, and that's again an improvement from the previous result. You can again see a mix of Fetches as well as Updates and pretty efficient utilization of CPU, as well as Memory resources.
And like I said, NCache is linearly scalable, so, let's review our scalability numbers. You know, by increasing number of servers, you can see NCache scales out in a pretty linear fashion. With 5 NCache servers, we were able to achieve 2 Million Requests per second, and you can add more and more servers, and this trend would be further linear, where more Servers mean more request handling capacity, out of NCache.
Conclusion
This brings us towards the end of our video. All these test results and sample applications are available on our website, that you can download and review yourself, in your environment. And if there are any questions, please feel free to get in touch with our sales (sales@alachisoft.com) as well as with our support (support@alachisoft.com) team. Thank you very much for your time.