How to Monitor NCache Cluster
Monitoring system performance while it is in operation mode is essential part of making system improvement decisions. Similarly, monitoring cache cluster is important in controlling cache behaviors in order to get maximum benefit from it. NCache provides various options to monitor "NCache Cache Cluster Health" and "Performance Statistics". This document will explain these options and how these can be used for cache cluster health and performance monitoring.
NCache logs all cache level errors/events in "NCache Log Files" and "Windows Event Logs" by default. NCache cache logs show more detailed information and are generally helpful for debugging purposes. NCache cluster events on the other hand can be monitored regularly to get notified for any cluster level issues.
NCache also provides extensive set of performance counters for cache server and client performance statistics. These are very helpful in regular NCache performance monitoring as well as for debugging performance issues.
System administrators can use NCache monitoring capabilities or any third party tools using these cluster events and performance counters and can take necessary actions accordingly. NCache provides various ways to monitor you cache cluster.
Here are details on various options available for NCache monitoring:
1. NCache Email Alert Notifications
- Enable Email Notifications: Email notifications will be enabled by selecting an Enable Email Notifications check box.
- Sender Email: Enter the sender email ID.
- SMTP Server: Specify your SMTP server name.
- Port: Default port of a server is 25 but you can change it.
- SSL Required: Secure Server Layer if enabled then email should be send through SSL channel.
- Authentication Required: If the option is enabled then login and password will be required for authentication.
- Authentication Required: If the option is enabled then login and password will be required for authentication.
- Login: It is the user name only required if 'Authentication Required' is enabled.
- Password: Password is required only if 'Authentication Required' is enabled.
- To: Specify email recipients (more than one recipient can be specified in this area)
- Cache Start : (If cache has started)
- Cache Stop (If cache has stopped)
- Cache Size (If cache becomes full)
- State Transfer (The server level data transfer in case of node joining or leaving cache)
- Node Joined (If a server joins the cache cluster)
- Node Left (If a server leaves the cache cluster)
NCache provides cache cluster monitoring with the help of NCache email alert system. These email alerts can be configured and System Administrators can be notified via email for any planned or unplanned cache cluster events such as if cache stops, cache starts, a node leaves or joins a cache etc.
NCache email alerts can be configured from Alerts tab on your cache as follows:
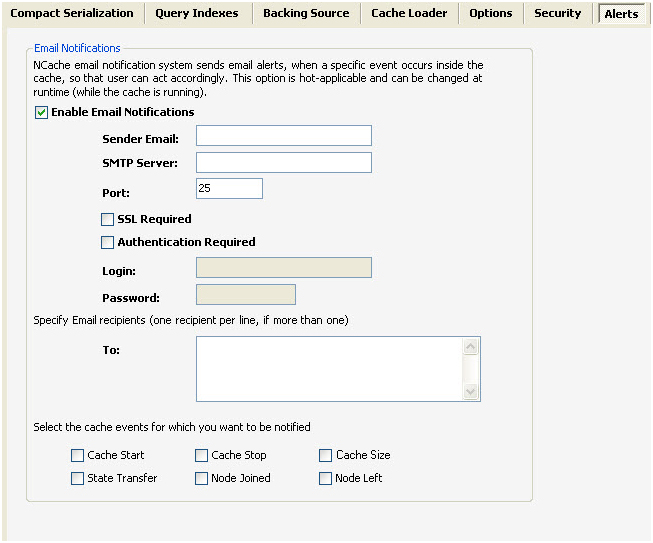
A user can provide their email server details as follows along with recipients email addresses and NCache would send email notifications to all recipients for selected cache events.
Select the events for which the notification is required, listed on the tab. Here are details on events for which an email alert can be enabled:
A system admin can take necessary actions if he finds an email for any of above events and if it is not found to be a planned event.
2. NCache Event IDs
All cache cluster level events are logged in windows event log by default. You can use NCache email alerts or any 3rd party tool that uses these NCache cluster events to get notified accordingly. It is always a good practice to verify cache cluster health as soon as you see such an event logged in windows event logs. Here are details on important NCache event IDs:
Event |
EventID |
| CacheStart | 1000 |
| CacheStop | 1001 |
| CacheStartError | 1002 |
| CacheStopError | 1003 |
| ClientConnected | 1004 |
| ClientDisconnected | 1005 |
| NodeJoined | 1006 |
| NodeLeft | 1007 |
| StateTransferStart | 1008 |
| StateTransferStop | 1009 |
| StateTransferError | 1010 |
| UnhandledException | 1011 |
| LoginFailure | 1012 |
| ServiceStartFailure | 1013 |
| LoggingEnabled | 1014 |
| LoggingDisabled | 1015 |
| CacheSizeWarning | 1016 |
| GeneralError | 1017 |
| GeneralInformation | 1018 |
| ConfigurationError | 1019 |
| LicensingError | 1020 |
| SecurityError | 1021 |
3. NCache Monitor Tool
- Start --> Programs --> NCache --> NCache Monitor
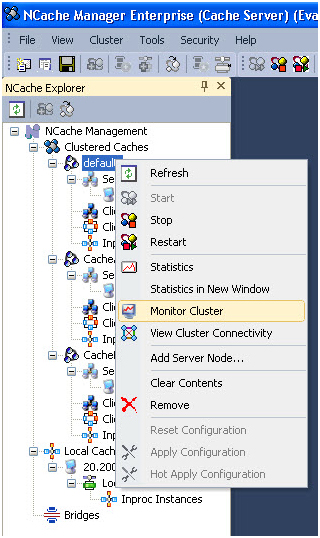
- From NCache Manager, Right click on the 'Cluster' you want to monitor from the 'NCache Management' tree and select 'Monitor Cluster' option from the context menu. It will open the NCache Monitor.
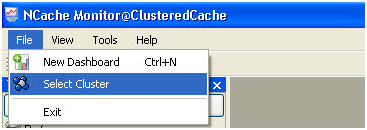
- NCache Monitor provides you the facility to monitor various resources. The first step which needs to be performed is the selection of a cluster. 'Select Cluster' Wizard appears at the start up of the application or using the File --> Select Cluster option.
- After selection of a cluster in NCache Monitor, now you can either use default dashboards for monitoring performance, health or events of cache cluster or you can create your own custom dashboard according to your requirements.
- Dashboard provides different types of views for monitoring various widgets. Views are specific to the widgets. Three types of monitoring views can be displayed in a dashboard as listed below:
1. Graphs
2. Lists
3. PerfMon
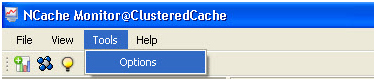
- NCache Monitor provides you the facility to set properties for different views. 'Options' menu provides various preferences to customize NCache Monitor graphs and lists. You can access the option dialog from Tools --> Options.
Toolbox contains different counters for monitoring performance, health and events of a cache cluster. Widgets are categorized in two groups that are:
1. NCache Server: It contains pre-define NCache server widgets.
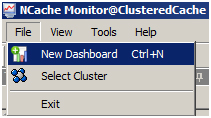
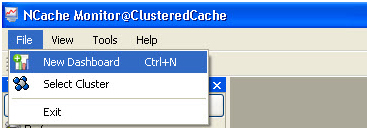
2. NCache Client: It contains pre-define NCache client widgets. - Step 1: Select 'File' --> 'New Dashboard' to create a new dashboard as shown in the figure below.
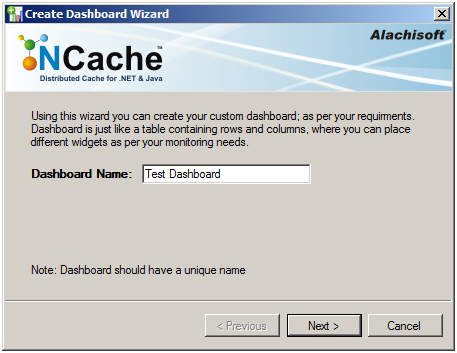
- Step 2: Following screen will appear for creating a new dashboard.
Enter 'Dashboard Name'.
Click 'Next' to move to the next screen.
- Step 3: Specify number of Rows and Columns required in a dashboard.
You can set different number of columns in every row.
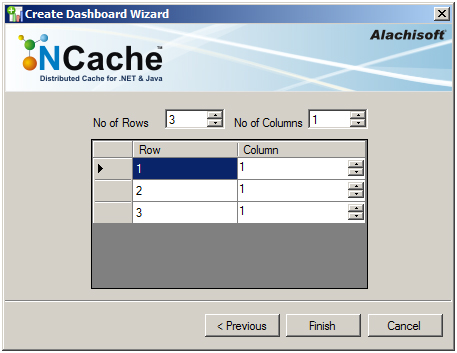
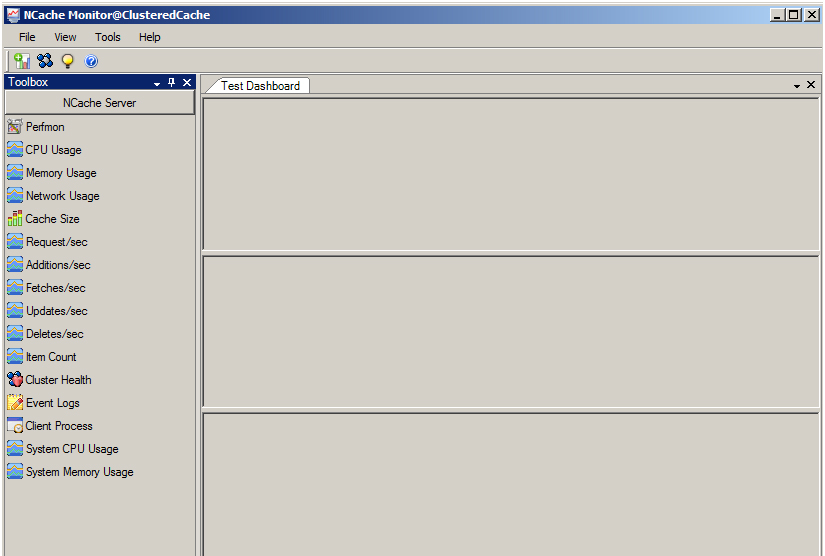
On finishing the above steps following screen will be displayed having three rows and a single column as specified above.
You can create more than one dashboard for a selected cache cluster.
All the open dashboards created against cluster will be automatically saved on closing NCache Monitor, and will be retrieved whenever that cluster is selected for monitoring.
The closed dashboards are not saved for a selected cluster. - Step 4: You can monitor the widgets of a selected cache cluster by dragging a counter from a Toolbox to a dashboard.
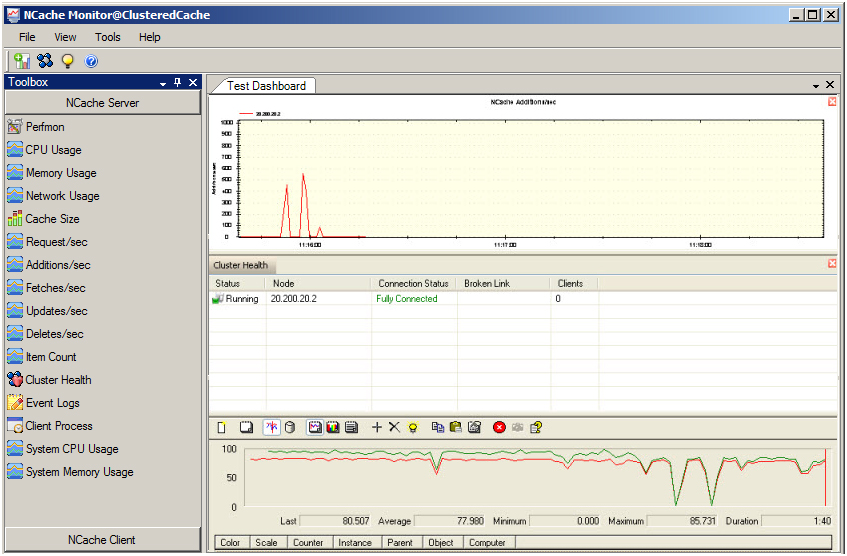
NCache Monitor is a diagnostic tool to analyze performance, health and events of a cache cluster both on a local and remote machine. Cache administrators can monitor cache events, view detailed health information of all nodes in a cluster and monitor performance of a cluster using real time statistics. NCache Monitor can run as a separate application and can monitor any cache from any box in your environment.
A. NCache Monitor GUI Overview
NCache Monitor tool can be launched in two ways:
OR
Following are some of the main operations you can perform using NCache Monitor:
B. Default Server Dashboard
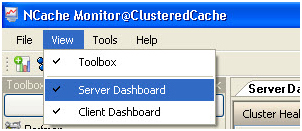
Server Dashboard is one of the default dashboards which appear automatically after the selection of a cluster. You can also retrieve this dashboard at any time from View option as follow:
Please refer to NCache Help documentation for more details on available monitoring options in default server dashboard.
C. Default Client Dashboard
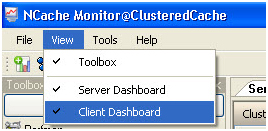
Client Dashboard is also one of the default dashboards that can be retrieved any time using View option. Client dashboard contains following graphs:
You can view the client Dashboard from the following option:
This will open another window that can be used to visualize client statistics for monitoring.
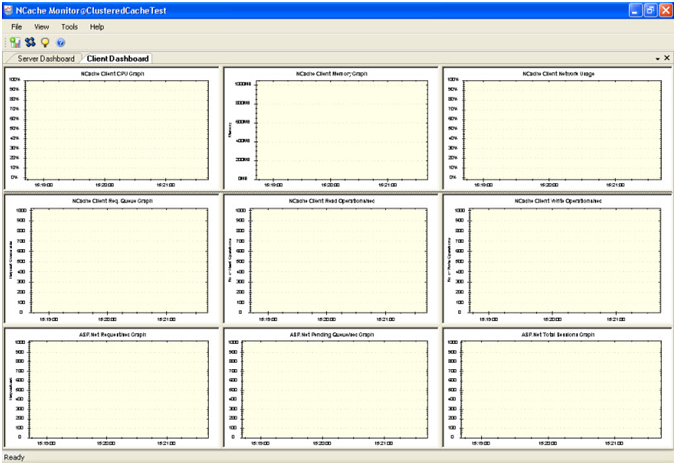
Please refer to NCache online help for more details on available monitoring options in default client dashboard.
D. Monitor NCache Cluster
After selection of a cluster in NCache Monitor, you can create your own dashboards according to your needs and can visualize NCache servers as well as client counters accordingly. To create a new custom dashboard, follow these steps: