Six Ways to Optimize NCache Performance
Recorded webinar
By Kal Ali and Sam Awan
NCache is a popular Open Source In-Memory Distributed Cache for .NET. It helps you scale your .NET applications by caching application data and reducing those expensive database trips. NCache scales linearly by allowing you to add more cache servers to the caching tier cluster.
Learn how to optimize NCache performance by configuring it properly and also by using its performance boosting features.
This webinar covers:
- Introduction to NCache and its architecture
- Common ways NCache is used
- NCache performance boosting features
- NCache performance boosting configuration options
Overview
Today, we're going to be presenting a webinar on six tricks to improve NCache performance. The mode of this webinar would be listen only. You will have the ability to ask any type of question that you want. There is a question and answer tab on the right hand side pane. You would be able to type your questions and one of us will be able to answer those questions for you. During the webinar, if you have any questions or concerns and if you're not able to hear us, please - again you can use the chat window. Kal is going to be talking all the technical part of the presentation. If there are anything that is not so technical or sales related, you guys can direct your questions to me directly. With that being said, I'm going to hand it over to Kal and he is going to start the presentation.
All right. Thank you Sam. Could you just confirm that you’re able to see my screen, because I just started sharing it? Yes, I can see your screen perfectly fine. All right, perfect. So, hey guys as Sam just introduced me, my name is Kal and the topic for today's webinar is, Six Ways to Optimize NCache Performance.
So, in today's webinar we will be covering some general details in regards to NCache and also what features that you can use within your application to optimize the performance. So, NCache already is a performance solution. It increases your performance for your applications quickly, because it reduces your trips to the database. But, with these features you can actually improve that even further and these six tricks are going to be actually use case based. I'm going to be presenting a use case alongside each one of them and based on that whichever one applies to your specific scenario, you can definitely use this and see how this works for you. So, we're going to be covering some actual hands-on, you know, demos of different applications and according to that we'll see how in different situations NCache works and how these features actually help us. So, I'm going to proceed with the presentation now.
The Scalability Problem
So, first of all, let's actually talk about the scalability problem that's seen in most deployment scenarios. So, usually you have a web farm, which is sitting behind a load balancer and this sort of tier, this scenario is usually very scalable. Because, as you see that there's more load coming in on to your applications, you can just basically add more servers to this tier and that would actually increase the capacity of your environment, in terms of the total load that it can take in or for example total requests that it can take in, let’s say, against in one second.
The actual issue, the actual bottleneck lies where these applications have to get in touch with the backend data source. Maybe to get some reference data, maybe to get some other sort of data that is stored there. So, basically that's where the bottleneck is. Usually the backend data source is a database. As we all know, databases are excellent for storage but the issue lies where they're generally slow because they're on disk. They tend to choke under high transaction load and they're not very scalable.
The Solution
So, in such scenarios companies / organizations tend to move towards a NoSQL database, but that's not the optimum approach at this point. Because, that requires a whole architectural change, not just within your application but also within your actual data to make them compatible with each other. So, in such scenarios, an optimum approach would be an in-memory distributed cache, such as NCache, which is more faster and more scalable, because, everything is placed within the memory. So, if we compare it to a database, in that case it was present on the disk. So, now we’ve everything present within the memory. It’s more scalable because the distributed cache is logically a single unit but underneath you have multiple independent servers hosting this clustered cache.
It's a very scalable topology. You can add as many servers here as you want. As you know, what it does is, it basically pools in not just the memory resources for all these servers but also the computational power of all these resources. So, as you add more numbers of servers, it increases your capacity of the cache in terms of the total data that can be stored. As well as the total operations or total load that it can take.
So, when you see that there's more load coming in on your web farm you can actually increase number of servers on your caching cluster as well and that would actually make this tier also scalable. So, now your caching tier is matching up to the requests that are coming in from the web farm. So, now it actually helps in to remove that non scalability part that was present with the database. The best part about this is, that it's not a replacement to a database. You can use it alongside with it. So, what it does is, basically the cache cluster sits right in between your applications and your database. You can still make direct calls. But, what it does is, you can make NCache your sole source for data and using that we have data access layer features that are provided with this cache, through which you can actually, the cache can actually write data onto the back-end data sources as well as get data from the back-end data sources.
So, using this, your cache remains in-sync with back-end data sources. So, you have up-to-date data from a faster source because it's present within the memory and it's a more scalable source as well. So, it's a very good trade-off in this case.
NCache Deployment
So, let's talk about the NCache deployment in this diagram. So, here if you can see that, these are your basically application servers or web servers where you have your application hosted. They're usually sitting behind a load balancer. Previously they were making direct calls to the back-end data sources, such as a database but now you have the caching tier present right here. This is the recommended deployment by us is that you have a dedicated caching tier hosting your clustered caches.
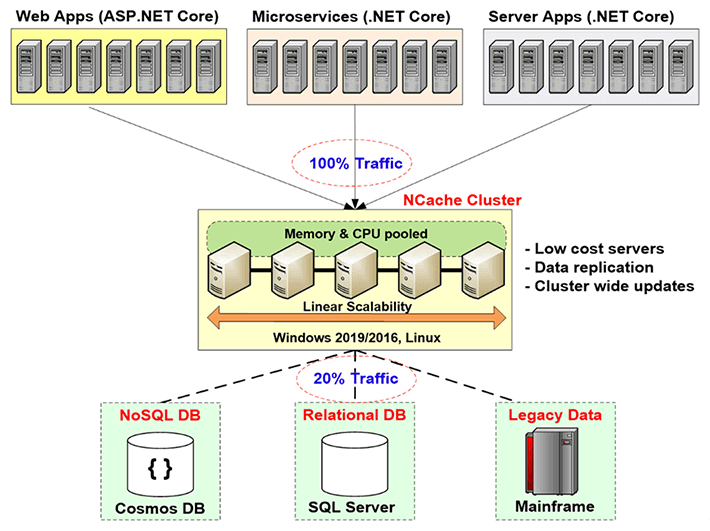
So, what your applications are doing, they're making NCache the sole source for data. All their requests for get data or even some sort of processing are done directly on the cache and if the cache does not have it using those data access layer providers it can actually get from back in data sources. So, this is what it is doing within your environment. These servers, as I mentioned earlier, they're recommended to be dedicated servers and they are very inexpensive servers. The only prerequisite for NCache in this case is just the .NET framework. On these servers which are hosting the cluster cache, you have the cache server installation, which has the capability of hosting cluster caches and on the client, on these client boxes right here, which are your application servers, you have the remote client installation, which can host local caches and it can actually help connect to remote clustered caches.
So, this is how the deployment looks like. All of this is linearly scalable. As we add more number of servers, increase the total capacity of the cache.
Three Common Uses of NCache
Let's talk about the three common uses of NCache. I'm quickly going through all these things because I want to get to those six ways and get in details for those, so, that if there any questions I can definitely answer those. So, let's talk about the three common uses of NCache.
-
Application Data Caching
First one is Application Data Caching. So, on this slide we were talking about the three common uses of NCache. So, first one is application data caching. In this case, basically, what you do is, you introduce the NCache API within your application and using that API you can add items and get items from the cache and you can perform different operations on the cache, where how the way they're required. So, what NCache does it has the capability host of, basically, you can cache anything within NCache. It can be images, it can be some custom objects, domain objects, it can be collections, basically anything. So, anything that is .NET permitable can be cached within NCache and using your applications by introducing the NCache API, very simple to use, very easy to use, you can actually perform different operations on the cache and actually add and fetch items.
ASP.NET, ASP.NET Core Caching
The next use case is in regards to ASP.NET, ASP.NET Core caching. So, first one in that is, you can use NCache as session state provider. Can be the single-site or multi-site. The next is that you can have NCache store your view state. This is something that is pre-MVC. After that the concept of view state was not present anymore. After that we have for ASP.NET we have the output cache provider. NCache can act as that and then for ASP.NET Core applications it can be Core Response Caching. So, you can do that with NCache. NCache can also act as a SignalR Backplane. So, all of these options that have just covered in number 2 are actually no code change options. You do not need to make any sort of code changes. You can just basically update your applications configuration file and using those you can actually have NCache to store whichever thing that you want to store. It could be Sessions, it could be View State, it could be your outputs or even the Core Response Caching. So, using this you can have NCache store those things. So, basically in this case, again no code change option, very easy to use. A couple of steps are required. We have complete documentation. We have samples as well and following those steps and that documentation, even the samples, you can you can set it up within 15 minutes. You can have everything set up. We can actually test it out, see how that works for you.
Pub/Sub and Runtime Data Sharing through Events
The next one is Pub/Sub and Runtime Data Sharing through Events. So, basically in this case you have, let's say, you have serverless apps and you want to make sure that there's some sort of synchronization between them they want to pass certain messages, certain data. NCache can be used as a medium just for that. You could have publishers, you could have subscribers and they could publish some messages. Subscribers which are registered to those, let's say, clients can actually get those to get that data from those from NCache in that case.
So, a typical example would be a group chat application. Maybe you have members of the group, all connected to the same cache, they are actually in a group chat. One of the members post some message, all the other members of that group would get a notification of that data that it has been added. So, this is just a basic example and then we also have even driven notifications and continuous query.
So, these were the things that NCache actually offers you and what is basically used by most of our customers.
NCache Architecture
Let's actually talk about the NCache Architecture now. Let’s explain how that works? So, basically NCache is a 100% peer-to-peer architecture. There's no single point of failure and there's no master slave or majority rule or any similar concept within NCache. Servers can be added and removed on the fly. The cache does not need to be stopped and it would continue to work just fine. Even in the case that if one of the server goes down, basically in an unforeseen scenario, the cluster does not the complete cluster does not go down. It starts the recovery logic, between the servers to redistribute that data or get the data from one of the backups and on the client side the clients actually failover their connections to the remaining servers present within the cluster.
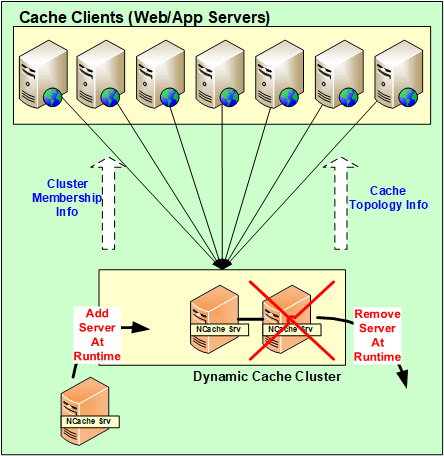
So, using this the data is actually not lost and the clients their connections are actually, they failover to the other servers. So, they continue to make the requests even if one of the server has gone down. So, as long as you have one server up and running, your request would get handled.
So, all these changes, all these configurational changes servers being added, removed on-the-fly for unforeseen scenario, all these are actually propagated throughout the cluster. So, all these configurations are actually dynamic. Any update within the cluster and in terms of the configuration, gets mapped on to all of the servers present within the cluster and the clients automatically know about it as well.
NCache System Requirements
Cache Servers
Let's talk about it the NCache system requirements. So, generally in terms of, let's say, if you talk about cores, the more the better. But, generally speaking, we recommend having 8+ cores. The main three things that NCache uses is CPU, network resources, and Memory. CPU is used to basically handle the requests that are coming in, or maybe if there are any server-side code that has been configured to do those sort of operations, that's why the CPU is used. Secondly, the RAM is used just for storage and maybe some overhead involved after the data has been stored and in the network resources are used to maintain the communication. For example, from server to server communication and then from client to server communication. So, you have both of these options and then the recommended Windows Servers are 2012, 2016. The only pre-req of NCache is .NET framework, otherwise, it is supported in all Windows environments.
Remote Clients
In terms of the remote clients, the only pre-req is having .NET 4.0 or above and your client would actually be supported. You can have NCache on those servers.
Setup Environment
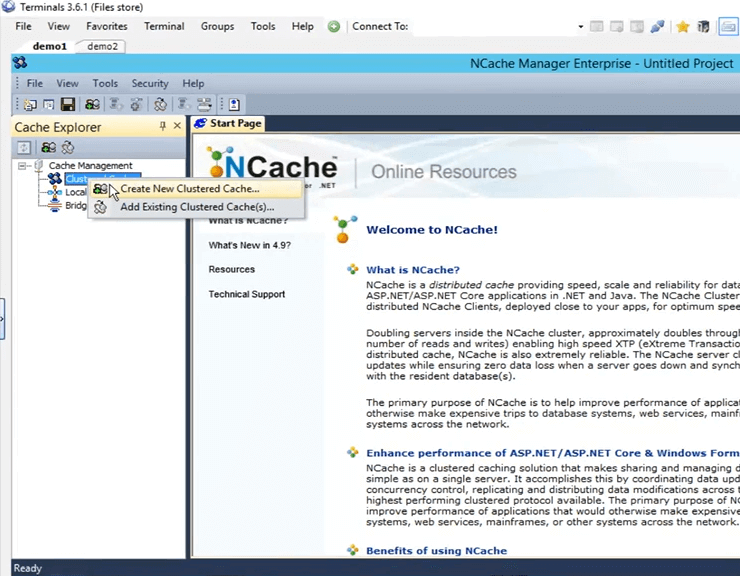
So, now that we've talked about the different things, the basic, you know, the introduction regarding NCache, let's talk about how we can set up the environment. So, whenever we have customers evaluating our product, what we tell them, we give them five steps to working with NCache. First one is download a fresh copy of the NCache Enterprise from the website and second is to install NCache within your environment. I have got NCache already installed on two of my machines. They are actually remote boxes demo1 and demo2. And, on these boxes once I install NCache, I get a managing tool of NCache called NCache manager. Using this tool I can actually create caches, configure them and perform different operations and even monitoring is involved in this case.
Create a Cache through NCache Manager
So, let's go ahead and open up the NCache manager here. I just need to search for NCache and it automatically comes up. So, once you open it up, this is the view that you get. So, now what we need to do is, we need to create a new clustered cache. To create that, right-click on the 'Clustered Caches', click on 'Create New Clustered Cache'.
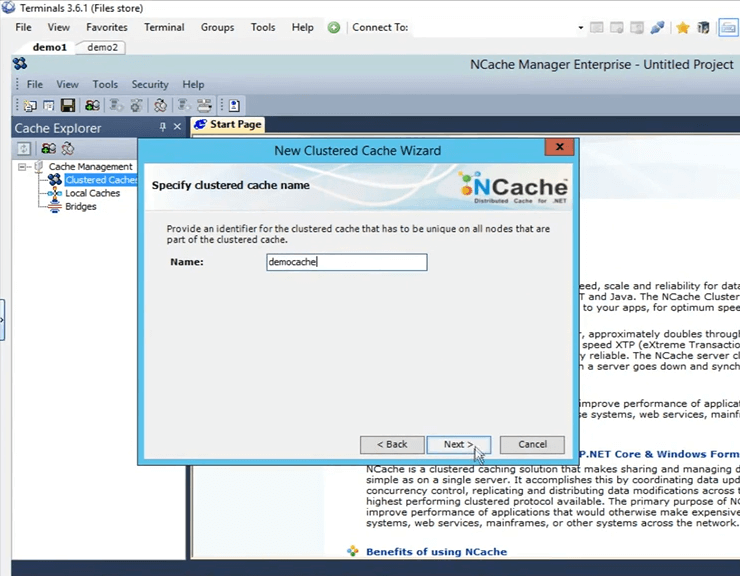
So, here what I need to do is I need to give it a name. I'm going to go ahead and give it a name 'democache'. All caches need to be named. Just going to keep that. I'm going to click on next.
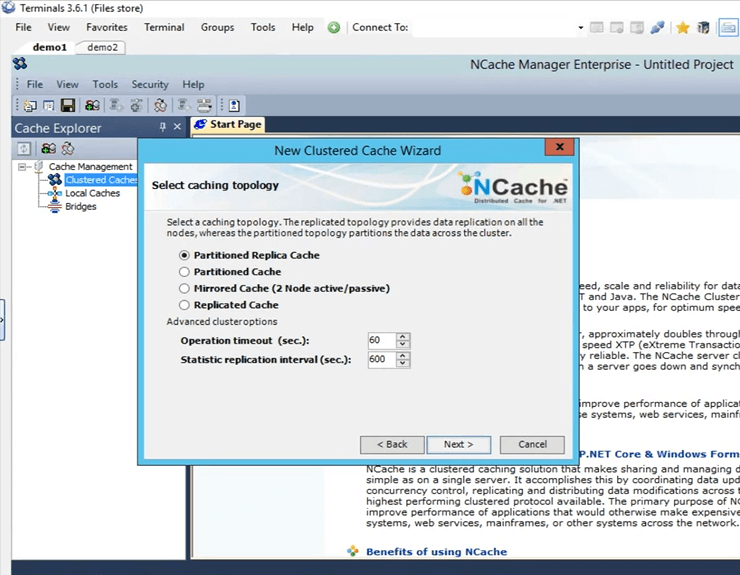
These are the four topologies offered by NCache I'm going to keep 'Partitioned Replica' selected because it is the most recommended one and most popular one amongst all of our customers. It's very scalable, very reliable.
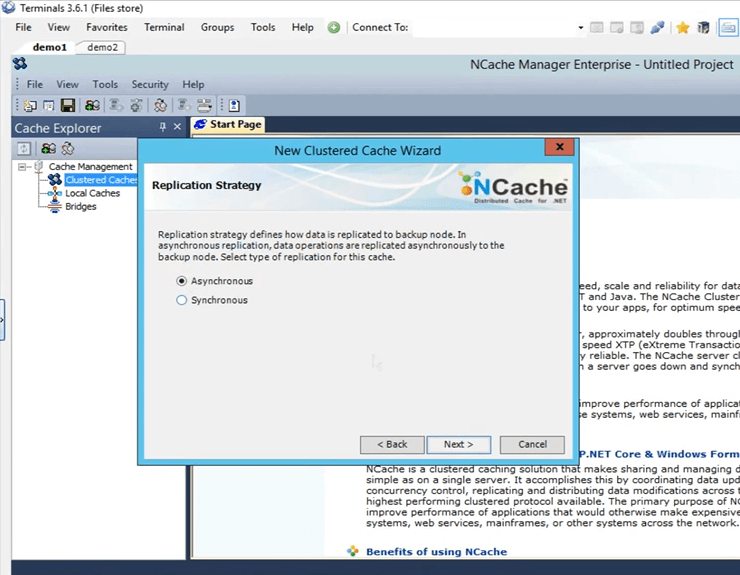
This is the replication strategy between the active partition and the backup partition in the case of partitioned replica. I'm going to keep it to Async, as it is faster.
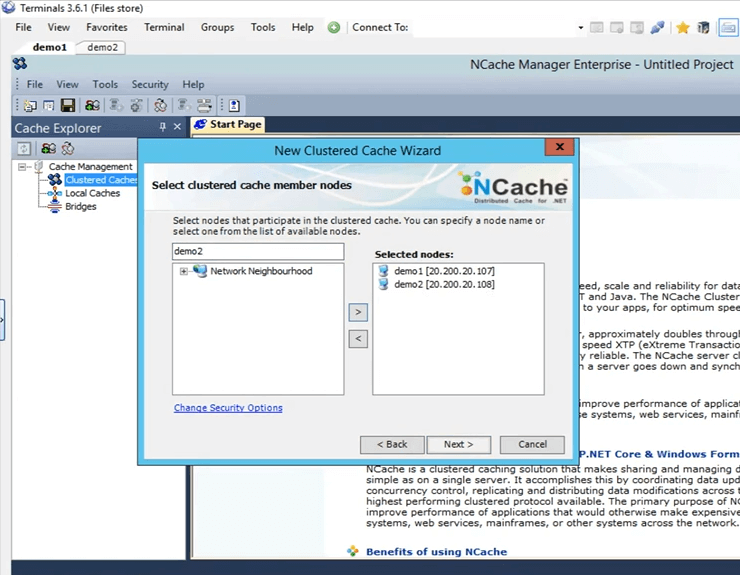
This is where I specify these servers which are going to be hosting this clustered cache. So, here I'm going to specify demo1 and demo2. These are the two boxes that I have, 107 and 108 and click on next.
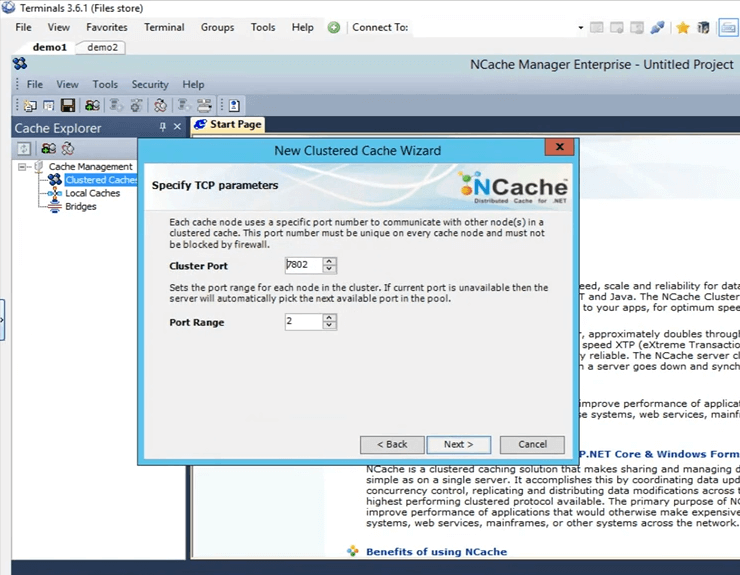
This is the cluster port on which the cluster communicates. It's picked up automatically.
This is the size that is configured on each box. So, there's going to be 2 Gig of total size, one on server1 and one on server2.
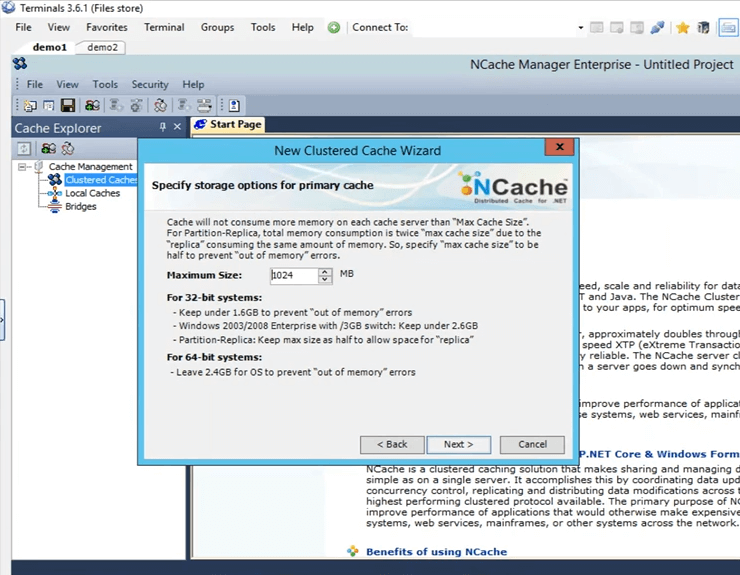
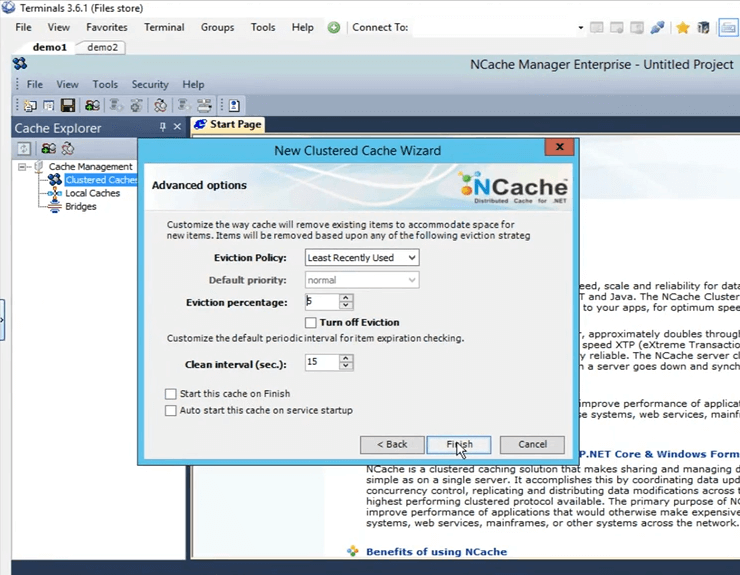
These are some advanced options. Maybe if you have cache getting full scenario, the cache can automatically remove items from the cache. If it's sensitive data you can actually turn off eviction, so, that the items do not get removed on their own and then you also have the option to auto start the cache as soon as it starts up, as soon as the machine starts. So, I'm just going to click on finish and that actually creates my cache.
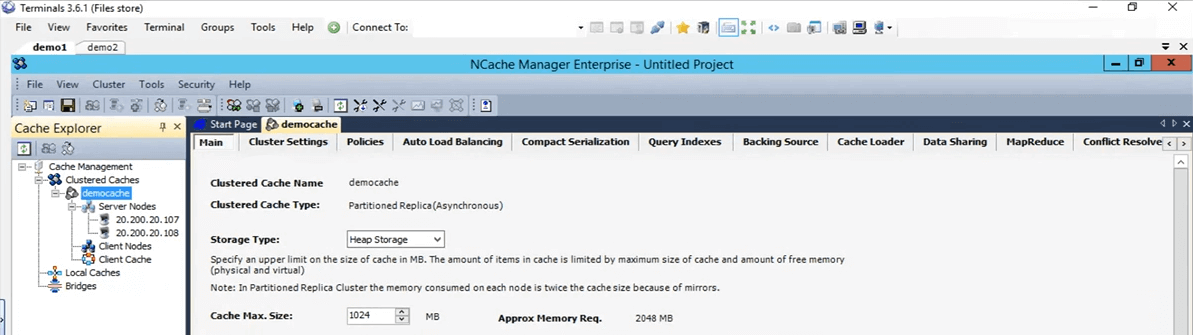
So, that's how easy it was to create a cache. I have the cache configured now. If I just do a left click on the cache name, it opens up all these different tabs here through which I can further do some changes or configurations if need be at this point.
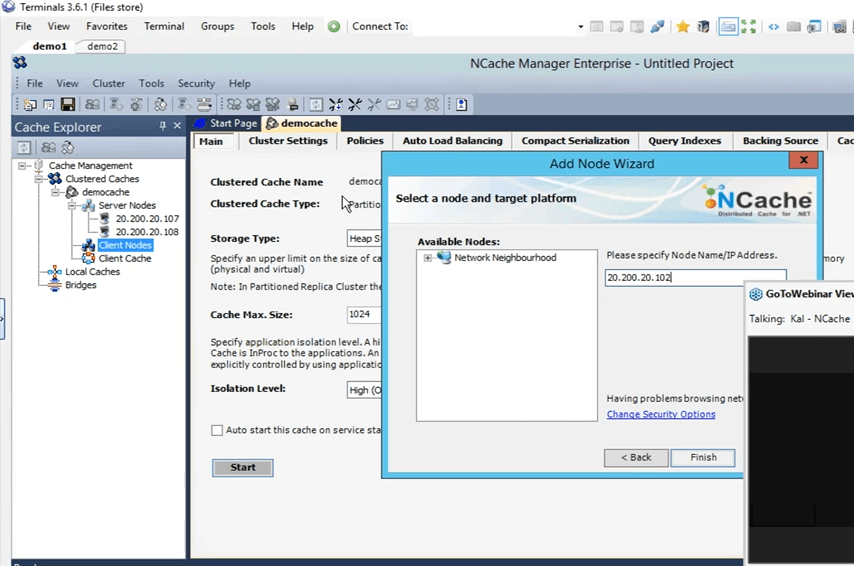
So, next I'm going to do is, I'm going to add my personal box as a remote client. To do that, just right click on the cache name and click on add node.
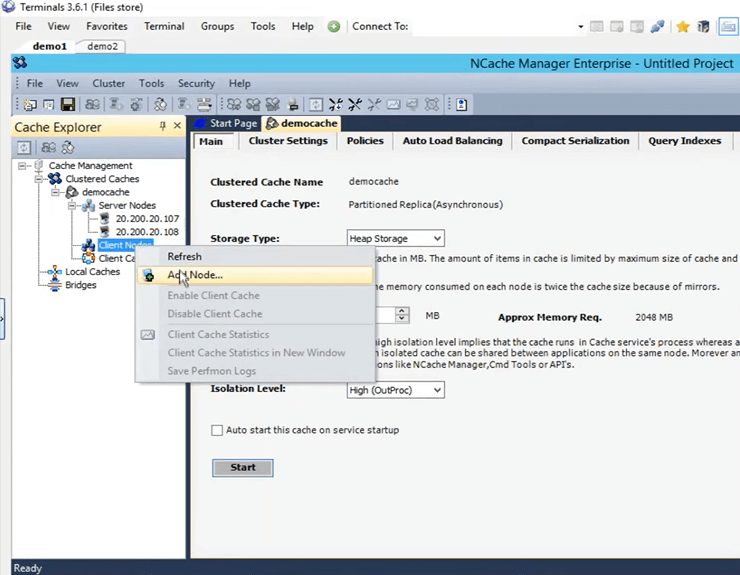
And, here I'm just going to give the IP of my personal box, that is 102 and now it is added.
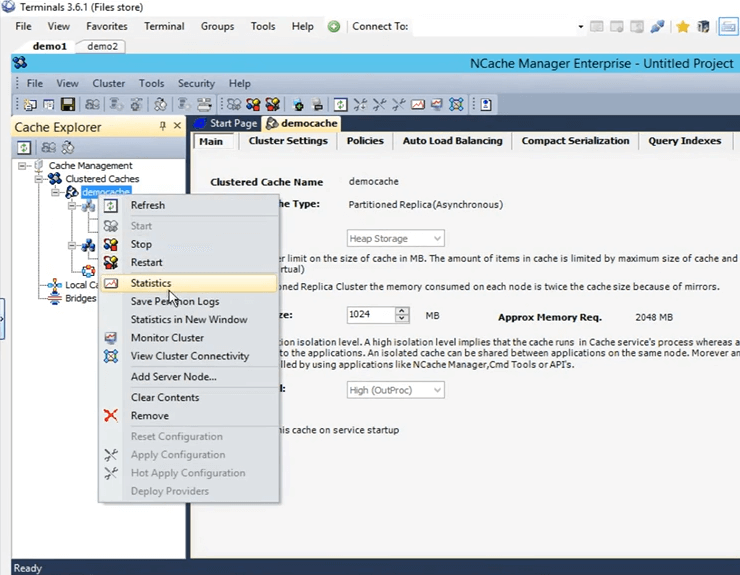
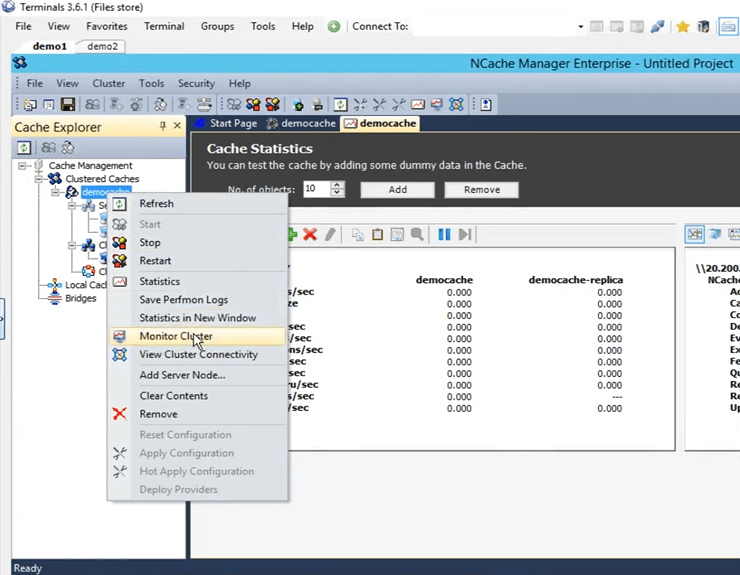
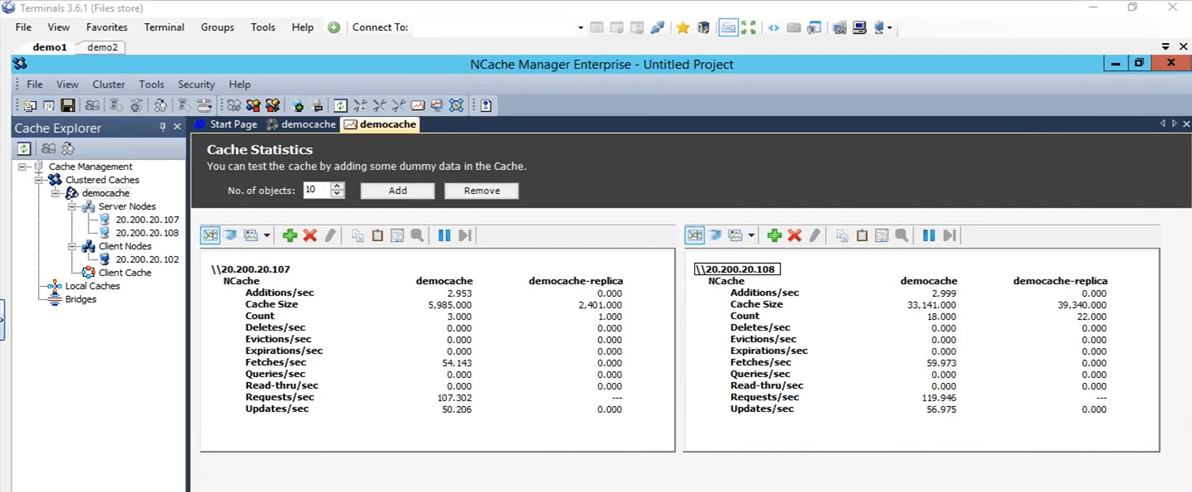
So, once it is added, I'm just going to right click on the cache name and click on start. So, now the cache is being started on 107 and 108 box. Once it is up and running I'm going to open up the statistics and I'm also going to show you a monitoring tool of NCache called NCache monitor, which goes into very deep down details in regards to checking basically different things that are going on within the cache. So, the cache is up and running now. To open up the stats, just right click on the cache name and click on statistics.
So, this is what it's going to pull up all these stats for both of these boxes 107 and 108.

So, now let's actually open up the monitoring tool of NCache. To open that up, right click on the cache name and click on monitor cluster.
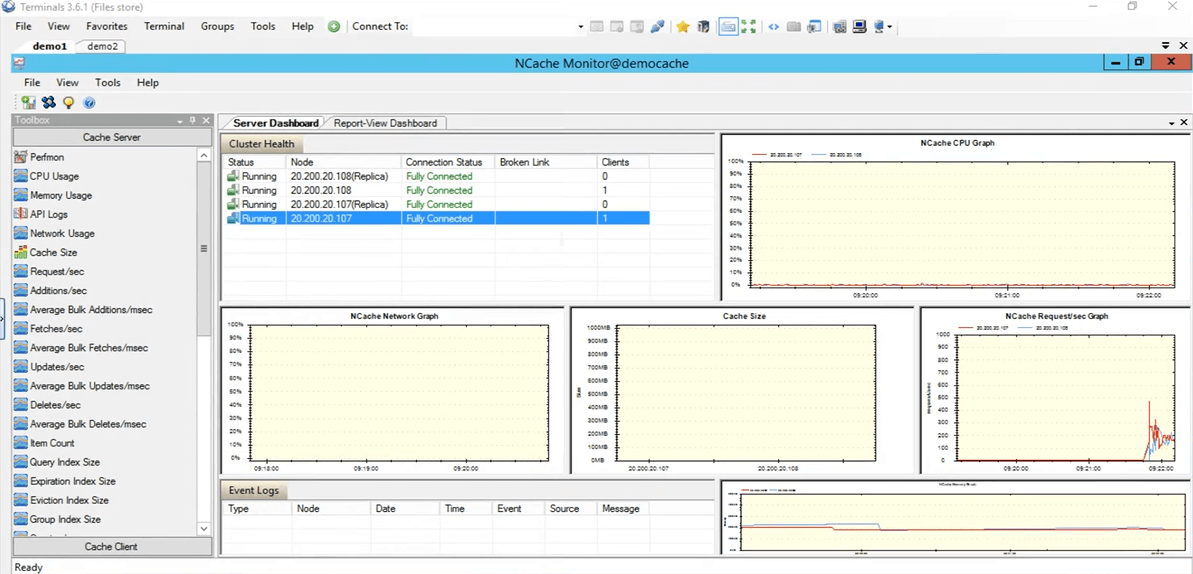
The NCache monitor is now going to open up which is going to give us two pre-configured dashboards, that is the server dashboard and report view dashboard. So, using this you can get a pretty good idea of what is going on within the cache. If we see right here, this is, for example, the cache size, that is currently being consumed and then this is the requests per second graph. So, it gives you a lot of different details that are currently going on within the cache and you can use these details to actually maybe debug some scenarios or get to the bottom of if you are seeing any sort of issues.
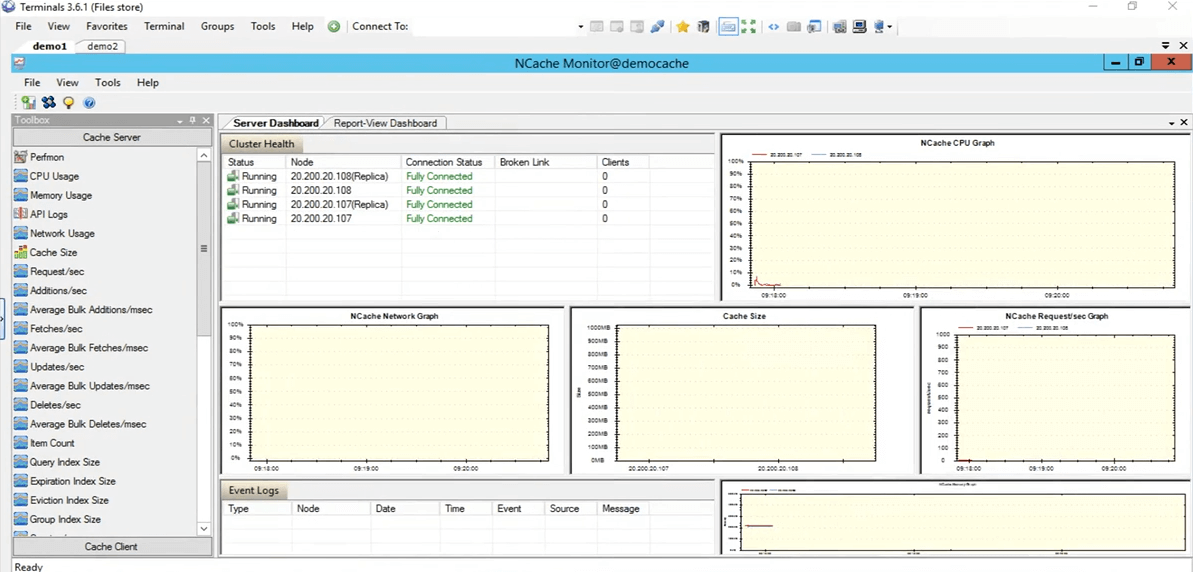
So, I'm just going to quickly come back to the NCache manager and here you can actually create your own custom dashboard as well. If you have any certain things that you want to look at not the ones that are pre-configured here, you can actually do that as well. You have controls present here under the category of cache server and then also under the category of cache clients. You can create your own custom dashboards as well to see only those things which you are actually interested in. So, let's come back to the NCache manager. Everything is showing up zero because we do not have any applications running against this cache.
Simulate Stress and Monitor Cache Statistics
So, actually, let's quickly test it out by running an application. So, I have the PowerShell opened up here. Let’s actually clear it up. Let's actually open up a new one. Okay, so, I've got a PowerShell opening up. So, what I'm going to do is, I'm going to run stresses tool application to add some dummy load on to my clustered cache, to simulate some activity. So, using that activity, we've been also going to monitor it through the NCache manager, as well as, through the NCache monitor, see how that works for us.
So run that stress test tool. I need to type it again. Let's kill the process first. In the meantime, if you have any questions, please feel free to post them in the questions and answer tab. Kal, I don't think we have any questions at the moment. Alright, perfect. Some reason it's not picking. I'm back Yup. Sorry, I was just going to say that, guys this session is being recorded. So, whatever reason if you're not able to attend the full session or if you missed the initial part you would be able to check this recording. I believe we're going to be posting it later in the week or early next week. So, you'll be able to go ahead and go through the full session again.
So, what I'm doing right now is I've actually gone directly into that directory, to open up the command prompt there and run the stress test tool. Okay, so, let's see, yeah, it’s picked up I'm just going to go ahead and give it the name stresstesttool.exe and then demo cache. So, now what it would be doing is, it is going to add some dummy data on to the cache. If we come back here, we should see some activity coming up on these two boxes right now. There it is. So, we see some activity coming up on both of these boxes 107 and 108.
In the topology that we have selected partitioned replica, each client has a connection to all the sever nodes present within the cluster that's why it is connecting to both the servers. If we come to the NCache monitor, we can see that there's one client connected against 108 and one against 107. If you look at the NCache request per second graph, we can see that there is some activity going on.
So, this test was just to verify if everything is, the cache is configured correctly everything is working just fine and that has been tested. So, I'm going to stop the stress test tool application. Now, let's come back to the NCache manager. Let's go ahead and clear this cache up, so, that for our further test there is no items present within the cache. So, everything is showing up at 0. Let's come back to the presentation. So, our environment is now set up and it's all ready. What we can do now is, we can proceed with the slides.
NCache Tricks – Performance Optimization
So, let's talk about the six ways that we are going to be using to optimize the performance, one by one. Just to reiterate NCache, the cluster cache is already a performance feature that performance, you know, enhances your performance within your application, your database trips are reduced and then you find data from a faster source that is an in-memory distributed cache. But, these features are actually going to help you further up on that performance depending on your specific use case.
- Client Cache
So, the first one that we're going to talk about is client cache. What it does is, it basically reduces your trips to the actual clustered cache.
- Bulk Calls
Then we're going to talk about bulk calls, which reduce trips to the cache in such a way that you perform only a single operation and using just a single call and multiple operations in return are going to be processed on the server end.
- Compression
Then you also have compression. Maybe if your object size is greater, you can use this to reduce the whole size of the object that is being added or being fetched. Generally, we recommend breaking down the object into smaller size but in the case that it's not possible you can use the compression feature.
- Async Updates
We also have async updates. So, using these, basically your application does not wait for the operation to be performed. Maybe you can create a separate task for this and then based on that you can afford that the data gets added on its own and if there's any sort of update that you want to get back, maybe the data did get added or not or if there was an issue you can just register for a callback against that.
- Compact Serialization
The next one is compact serialization. So, for example, if you have custom objects, domain objects, that are not marked as serializable and within a distributed cache, since it's completely out of process, all objects are going to be needed to be serialized. So, if you have this scenario where you cannot afford code change within your environment but you also need to have your custom objects or domain objects serializable, you can use the compact serialization feature of NCache to mark all of them as serializable and then using that you can actually continue using NCache within your environment. It's a no code change option. Just something that you can figure from the GUI and you have it all set up.
- Dual NICs
And then finally we have the dual NICs feature. So, if you want to separate out basically traffic from the client to server communication and server to server communication, separate network resources, you can actually do that with NCache. This is only in the case where you have, where your, you know, your network resources actually choked out by the excess traffic that's coming in. Only in those scenarios we would recommend that. But, if you don't see that those resources are being maxed out at that point, you can actually keep the same network interface card for both sort of communications.
Demo
So, let's actually perform our first test, in which we are going to be adding items into the cache and fetching items from the cache and we are going to use this as a baseline with the basic API that we have. Again, it's already optimized but we're going to use it as a baseline and perform different features on top of it and see how they work for us.
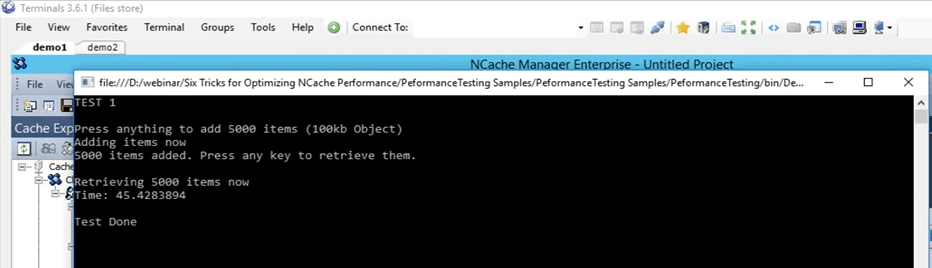
So, the first one, let's actually come back to this sample right here. So, this is a sample I can actually provide this code as well. This is what we are going to use to show you the baseline that we are going to be covering. So, we're in test 1. In test 1 what we're doing is we're basically adding 5,000 items into the cache of size 100 KB and then we're going to be fetching those items from the cache. This test will just get us the time it takes for this whole code, this fetching part is going to take. In this fetching part the loop is running actually 5000 times, because 5000 items need to be fetched and in the later slides we're going to cover how different features can actually help in this case.
...
try
{
cache = NCache.InitializeCache(args[0]);
cache.Clear();

Console.WriteLine("TEST 1\n");
Console.WriteLine("Press anything to add " + objectsCount + " items (100kb Object)");
Console.ReadKey();
Console.WriteLine("Adding items now");

for (int i = 0; i < objectsCount; i++)
{
 cache.Insert(key + i, obj1);
}

Console.WriteLine(objectsCount + " items added. Press any key to retrieve them.");
Console.ReadKey();
Console.WriteLine("\nRetrieving " + objectsCount + " items now");
datetime1 = DateTime.Now;
...
So, let's actually run this. Let’s first verify that everything is set correctly. Yes, democache test 1 and I'm going to run this. So, again this is test number one, just to get a baseline of how the numbers look like. I'm going to press on Enter. It's going to start adding items into the cache. If we come back to the NCache manager, that's here, we see that there's some activity going on. So, it's adding items into the cache. Since there are two servers in partition of replica topology, the data is being added on both these servers, are being added on server 1 that is 107 and also on server 2. So, the data is going to be divided. Over all total items within the cache are going to be 5,000.
So, in this case, let's actually wait for it to complete and once it completes, we can actually note down that number and use it for our comparison for the later features that we are going to be testing with. It’s almost done we have about 4,000 plus items being already added.
Bear in mind that it's a 100 KB object, which is quite a big size for, you know, testing but this was just to show you how different things look like. I think they are all added, yes, they are all added. The counter have actually stopped. If we click on Enter, it took, if we click on Enter it’s going to start retrieving these items from the cache and if you come back here it's going to display the time once it does. So, we can see that the fetches per second are actually going up and also the requests per second are going up for both of these servers. So, that actually shows you that there's a bit of activity going on starting to fetch those items from the cache. Once it is done fetching all the 5000 items from the cache, it is going to display the timer on the screen and using that timer we're going to set it as a baseline for our coming up tests.
Client Cache (Near Cache)
So, let's actually talk about the next one. The next one, the actual feature that we're going to use first one is client cache. So, let me explain what a client cache is? A client cache is basically a local cache, that's present on the client boxes and these client boxes, what it does is it reduces your trips to the clustered cache. Client cache is a subset of the clustered caches data. It is going to keep a local copy with itself of the clustered caches data. It remains in sync with the cluster cache.
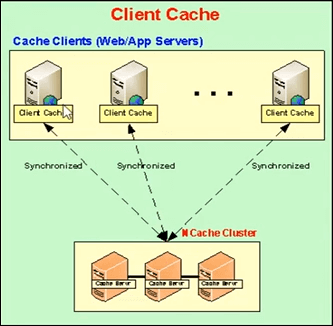
So, any updates performed on the client cache they're propagated on to the clustered cache and vice versa. So, it remains updated with the clustered cache and what it does is if your application is trying to fetch some items from the cache, it provides, if it does have those items locally present right here, it just shares that data or those items right there and then from a local source.
Let's actually jump back to this. Okay, it took about 45 seconds to do this operation. So, once we use the client cache, we can actually see how it affects within that scenario. I'm going to click on Enter. We're going to keep this remember, this number that is 45 seconds.
So, we were already talking about the client cache. So, as I mentioned earlier, basically there are two options you have. You can either run the client cache as an InProc or OutProc, it's something that you can figure. In the case of OutProc, a separate processes is going to run, which is going to be remaining, which is going to remain in sync with the clustered cache.
The OutProc process is generally recommended, when you have a web garden scenario where you have multiple applications or multiple instances of the applications running on the very same box. So, they would have a common resource to deal with, that is, the client cache, a separate process that's running. The second option is an InProc cache and that is recommended in the case if you have web farm scenario, where you usually have one or two applications running on the very same box.
In the case of one, what this is happening is that the client cache resides within the applications process. So, in that case since it's part of the same process, a lot of the overheads are actually removed. In this case the serialization overhead, the inter process communication overhead, all of these are actually removed and they increase the performance greatly.
In the case of OutProc what you are caching up on is that the application gets that data from a local source, that's present with on the very same box. So, a network trip is actually reduced. So, that boosts up the performance quite a bit and we can actually see that just now.
So, in this what we're going to do is, we're going to create a client cache, first as OutProc and then as InProc and we're going to see how the number numbers are look like. And in the current scenario, if you remember it took 45 seconds with normal gets.
Kal, I have a question here and the question is all the features that we're talking about are they part of the same product? So, I guess they're talking about editions.
Yes, a few of them are only available in the enterprise but I can share editions comparison document that actually covers each and every detail for all of them. So, maybe that would actually get you the exact details that you're looking for.
And, I will take this opportunity and ask everybody else are there any questions at the moment? Nope, we don't have any questions, so, please continue to talk.
Out-Proc Client Cache
So, I'm going to go ahead and clear the contents of the cache. They're done now. So, now I'm going to go ahead and create a client cache. So, in the NCache manager, you have the client cache written right here. Just right click here and click on create new client cache. So, here, I'm going to keep the name same. It’s set to client cache. Keep everything default. Next, it's set to OutProc now but we'll change it to InProc later on. Click on Next. The size it set to one Gig. I'm going to keep it that. I can actually change that to whichever one I want and some further advanced settings that were also present when we were creating a cluster cache. So, now the client cache is actually configured on my personal box, that is 102.
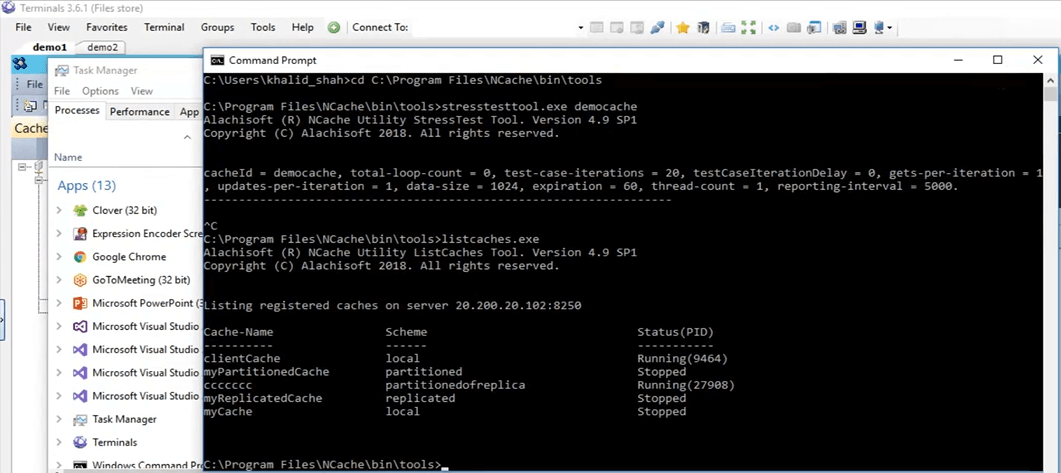
A quick way to verify this would be to just run the list caches tool, present within my personal box , once I install NCache and using that tool it actually lets me know which NCaches are running on my personal box at this point. So, here if I come up here, let's actually run list caches. Okay, it's displaying the caches present on my personal box, that is 102. I think in the back, it is still trying to enable it for some reason. Yeah, it seems to be enabled there. So, if you come here we can see that the client cache. So, the client cache is a local cache right here and it is running. So, it is running on my personal box at this point and we can actually use it now.
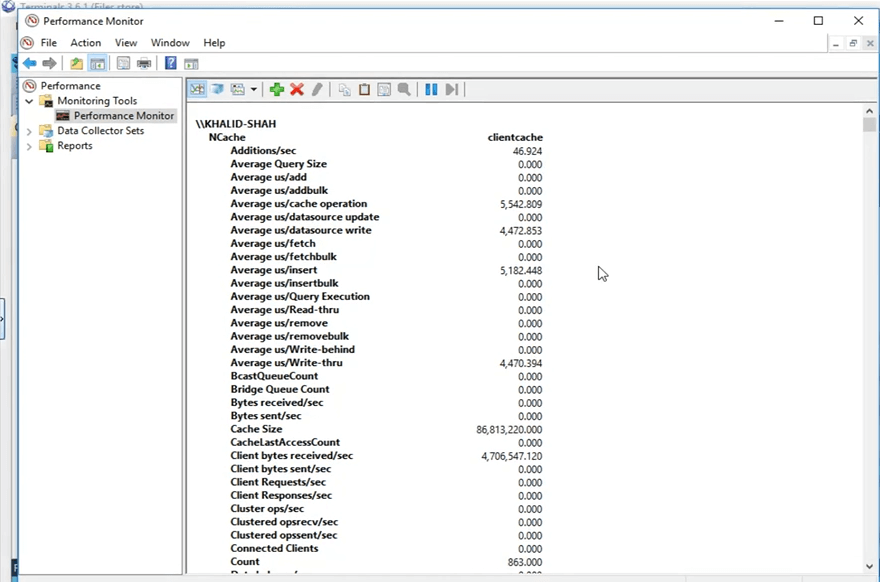
So, before I actually proceed, so, what NCache does is, it publishes these counters that are even displayed on the screen right now. So, they can be viewed through the windows performance monitor. What I'm going to do is, I'm going to open up the windows performance monitor and open up the counters for the client cache that I'm going to be using.
So, I'm going to, from my personal box, I'm going to search for a PerfMon that is performance monitoring right here, and using this what I'm going to do is, I'm going to open up the NCache category and look for my specific cache that was client cache and open up the counters for those. So, it's opened up now and I'm going to open up a brand new performance monitor, to look for the category of NCache. There it is and here I have the client cache as present right here. I'm going to click on add and I'm going to click on OK. I'm going to change the view to report view. So, now, these are the counters. Everything is showing up is 0 right now because it's not being used. It's a separate process that's running because we have set it to OutProc.
Let's see how the numbers look like now, from my personal box. I am going to run the application, same code, I'm not doing any sort of code change. The client cache features is a no code change, as I mentioned earlier, you just need to enable it or disable it, whichever one is your preferred, and then it would be picked up automatically. So, if I click on the start button, same code, same everything, even the same test, it is going to start adding those items once I click on the 'Enter'. Okay, so, once I click on enter, it started to add these items. If you come back to the NCache manager, we see that on the clustered cache the items are being added. If you open up the NCache monitor, that is this one, yes, this one, we see that there's some bit of activity going on here as well, and that's what I was explaining initially. When you have the client cache configured, it uses and when you add items into the cache the client cache also gets a copy and the clustered cache also gets a copy.
This use case is generally recommended where you have, for example, 80% to 20% reads to write ratio or even 70% to 30% reads to write ratio. This is generally recommended in scenarios where you have a lot of reads, maybe some reference data from static data that you have within your environment and that's where you would see great performance improvements when you have a client cache enabled.
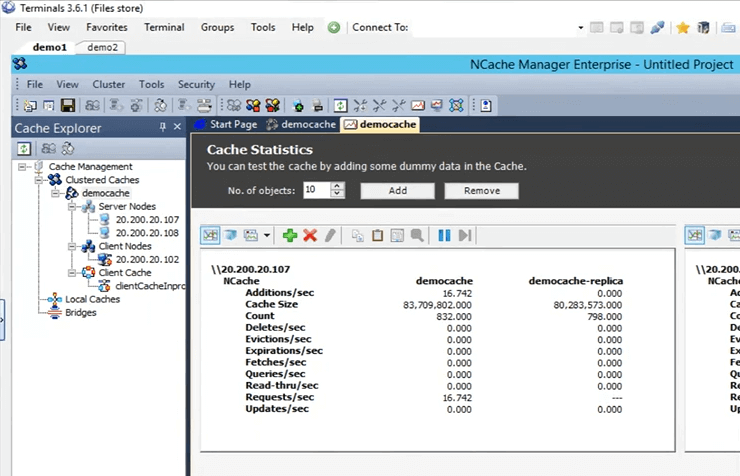
So, bear in mind, the first test with just the get API run in a loop, we got 45 seconds in which it was able to get those items from the cache. But, now using this client cache, it would find all that data within a local source, in a separate process that's running on the same box and we're going to see how that works for us. So, if we scroll down right here, we can see that this is the count of the client cache. This count has to go up to 5,000 because it's a single source. So, all the 5,000 items are going to be present here on the cluster and they're going to be distributed among all the server nodes. So, we're just waiting for these items to go up to 5,000 and then we're going to run the second part of the test that is where it fetches these items from the clustered cache.
So, another thing to notice would be that once we fetch the items from the cache, the calls would not be going to the clustered cache, they would all be intercepted by the client cache that's presently locally and that's what I'm going to show you from these counters, right here. So, these counters are showing up the client cache counters but if you come to this, these are showing the server side counters for the clustered cache. Let's click on enter here and it is going to start retrieving these items from the cache. So, again just to show you no card is being moved here. So, there's no call coming here. If you open up this one, we can see that this activity going on here. There are certain fetches going on. So, the client cache is being heavily used right now and that's the whole point of having a client cache in scenarios where you have more reads than writes. So, after a few seconds, we should see the results here of how long it took to show you 5,000 items of size 100 KB from the client cache scenario. So, here you can see that from 45 seconds it has gone down to 33 seconds with the case that you have an OutProc client cache enabled within your environment.
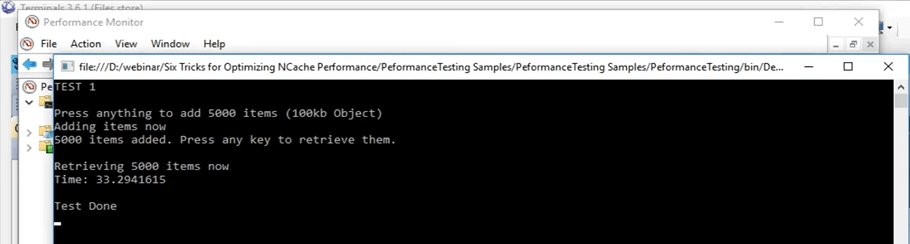
So, you can see it's a big improvement. It's more than 10 seconds that you can see and in terms of applications that's a big time. So, it has shown us great improvement in this case.
In-Proc Client Cache
So, I'm going to go ahead and create an In-Proc Client Cache now and using that InProc client cache, we're going to see how that performs for us in comparison to this 45 seconds for the actual test, 33 seconds for the client cache OutProc test. So, first of all I'm going to go ahead and remove this cache. Now it’s removed. I'm going to create a new cache. Again, I'm just going to type InProc next to it and I'm going to click on next and I'm going to keep the isolation level to be InProc, keep everything default and I'm going to click on finish. So, now this is created on my personal box and I'm going to run the exact same test. Actually, let's clear the data in the cache first.
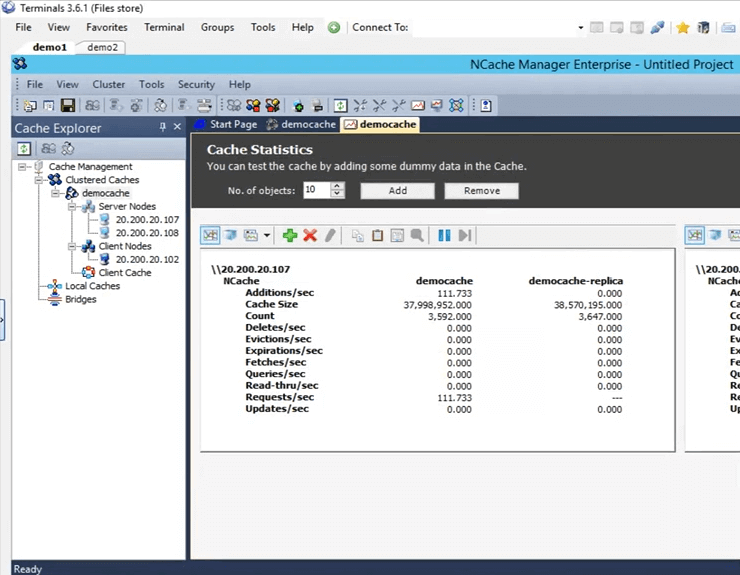
So, now same tests, same arguments, and I've just started it. So, now it's going to again perfrom the exact same test. 5000 items into the cache of size 100 KB and then it is going to fetch those items using the client InProc client cache. The concept remains the exact same. Once your application is adding items into the cache, you would also add it in the client cache that's present in the very same process, because we're now running it as an In Proc. So, it's adding those items into the client cache as well and it's also adding into the clustered cache. So, once it is, I'm going to click on enter now. So, once it is fetching those items it's going to find all those items within the local, within the very same process.
So, now without any overhead involved such as, inter process communication and serialization, deserialization, all of that is removed completely now. It would get the data right there and then from a local source and we would see how greatly the client cache is actually performing in with an InProc mode for this specific scenario. So, just waiting for the items to be added. If we come back here, we should see some counters going up and down. We can definitely see that.
So, in the meantime, guys if there any questions, please do let me know. Sam is keeping an eye on the question dock tab. He's going to inform me if there are any questions.
So, the next thing as I mentioned earlier in the list is going to be bulk operations. So, we're only going to be testing with a single one, that is using the bulk API. But, there are different concepts of different things that perform the very same way as the bulk operations and we're going to cover all of these in theory in this presentation. Let’s actually see how many items are added. So, about more than 3000 items have already been added. So, we're just waiting for the complete 5000 marker to reach and after that we are going to see how this works. Okay, stuck with the first one. So, I'm just waiting for the operations to be performed in the back. In the meantime, I'm just talking about the first thing here in the case of bulk operations.
So, the core concept of the bulk operation is just to restrict your actual, the amount of calls going into the clustered cache. So, instead of performing all those things within a loop, as we already did, we can actually do those very same calls as part of a single operation. So, single operation sent to the clustered cache and then multiple operations against that can be performed. So, if you share in the case of bulk you need to know the keys. So, for example, you just provided with the keys and the actual objects that you want to add, just a single call and using that all those items are going to be actually added into the clustered cache in the back.
So, I think they should be done, yes, they're almost done now. If we come back right here, so, all these items are now added. I'm going to click on enter and we can see that all those items are now retrieved. It's very astonishing to see because a lot of overheads were now removed. So, it was extremely fast. So, in the case if we reiterate on what the initial test we did, with the basic test it took 45 seconds, with the client cache OutProc it took about 33 seconds. But, in the case of InProc client cache, all this time has gone down to 0.1 second in this case.
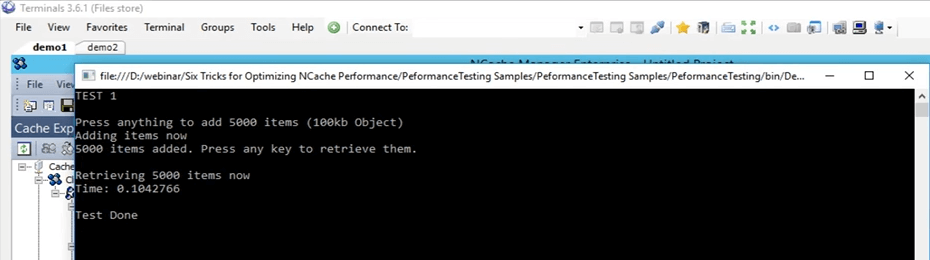
So, that's how much of improvement you can see with an InProc client cache if your use case maps onto the one we have got going on right here. So, this is a great improvement that you can see if you have more reads and more writes going on.
So, I'm just going to click on enter. So, that gets close. I'm going to remove this client cache here and actually cleared up as well. Okay, so, let's come back to the presentation. So, here, so, we were talking about bulk operations.
Bulk Get (Key Based)
So, in the case of bulk operations, the first one is that once you're adding, if you have a lot of items that you want to add or even fetch from the cache, you just need to provide it with the list accordingly and using just a single call you can perform all those operations on the cache. So, generally, if you have bigger object size, we recommend breaking it down into multiple objects and then using the features that NCache provides to actually group them or even get them or add them into the cache. So, bulk API can be used in those scenarios. The second one is, for example, if you don't know the keys of these items, since bulk was a key based operation, so, you need to know that all the keys.
SQL/LINQ Search Queries
In SQL or LINQ type search queries, basically if you don't know the keys, you can actually search on a certain criteria. For example, if you have products added within the cache, you can actually fetch multiple products from the cache based on a certain criteria. So, let's say, I run a query with the name 'SELECT product WHERE product.price > 10 AND product.price < 100'. So, all the products that actually satisfy that specific criteria and are present within the cache would actually be returned to me. So, in this case I did not specify any keys, I just specified with the criteria, and they were returned to me.
Groups & Subgroups
Next one is if you can create logical collections within the cache. I'm going to cover both of them together, as groups, subgroups and then tags as well. So, you can do that. So, for example, if you have customers and their orders placed within the cache, you can actually group all the orders together. Since there’re separate items into the cache, you can actually keep collections as well but we recommend breaking it down, because usually once you get an item from the cache you don't need the complete object you need a certain value against it. So, if you break it down into multiple objects you can use that in a more efficient manner. So, using these logical collection features, you can basically group items within the cache. So, all the orders of a certain customer can be grouped together and using just a single call. Let’s say that in groups, you can do a get by group or in the case of tags to get by tag, just provided with the customers ID and all these associated items present within the cache would actually be returned to you. Again, in this case you did not need to know the keys, you just need to know the certain string value that is a group or a tag and based on that it was returned to you and then it also supports parallel queries.
Bulk Operations - Demo
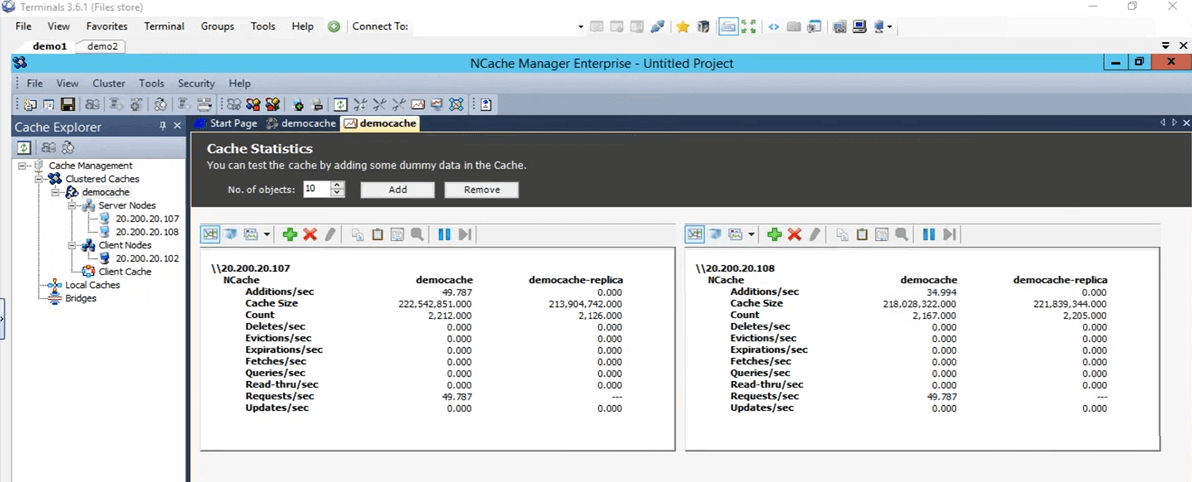
So, let's get down to the actual bulk operations sample. So, if you come back to this test, right here. This is the bulk test, that is test 2 and we're going to actually run that. Let's actually start it first and then we can get into the details as to what it is doing. So, I've just changed it to test 2 now and I've started it. So, what this test is doing is it is basically adding 10,000 items of size 10 KB into the cache right now. Firstly, it is doing just a basic insert of adding these items into the cache and then it's fetching all these items and it's actually logging the time for additions and the fetching part as well.
Console.WriteLine("TEST 2\n");
Console.WriteLine("Press anything to add " + objectsCountBulk + " items (10kb Object)");
Console.ReadKey();
Console.WriteLine("Adding items now");
datetime1 = DateTime.Now;
for (int i = 0; i < objectsCountBulk; i++)
{
cache.Insert(key + i, obj2);
}
datetime2 = DateTime.Now;
Console.WriteLine(objectsCountBulk + " items added. Time to add " + objectsCountBulk + " items in a loop: " + (datetime2 - datetime1).TotalSeconds);
Console.WriteLine("\nPress any key to retrieve them.");
Console.ReadKey();
So, once that is done we get a baseline of how much time it took to add 10,000 items of size 10 KB into the cache then it starts the bulk operations. In those bulk operations it adds all those 10,000 items into the cache just the same call and fetches again with just a single call as well with the keys list and the objects list predefined.
Ok, I'm going to click on enter. It's going to start adding those items into the cache. If we come back to the NCache manager we see that there's some bit of activity going on here. These items are now being added into both these servers that are currently present.
Even if you look at the monitor cluster we can see one client connected here, one client connected there and then we see that there's a bit of activity going on in these graphs. So, using this you can actually get a pretty good idea of what is going on within the cache, what is being used, what is not being used at this point and how much it is being used. It’s almost done all the 10,000 items, I think now added. Yes they are and I'm going to press Enter to retrieve these 10,000 items. So, first of all, it took around 37 seconds to add these items into the cache. Now, what it is doing is it is reading those 10,000 items from the cache. So, if you see, here we can see that there are some fetches per second going on both of these server nodes. So, the items are being currently fetched right now. So, it's now fetching in a loop right now. Bear in mind once it completes its going to start the bulk test. So, based on that bulk test, we will compare these two numbers and see how they actually affect. So, here it took about 30 seconds to retrieve these 10,000 items and with the bulk API has actually done with the additions and it should soon be done with the fetching part as well I think, oh yeah, need to press ENTER. Ok, let's actually wait for it to complete and then I can actually show you how all of these things look like. So, now it's complete. So, just to go over this test it added 10,000 items of size 10 KB into the cache using a loop and took about 37 seconds. To retrieve those 10,000 items it took about 30 seconds, again in a loop. With the bulk test, it added those 10,000 items into the cache and it took about 5 seconds.
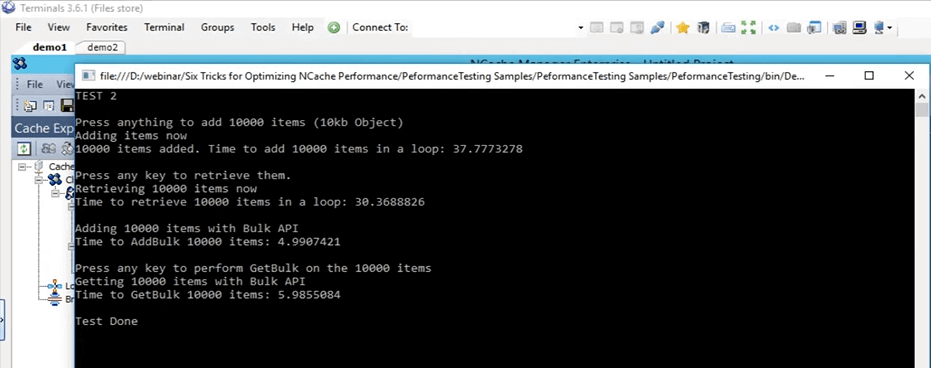
So, this is a big gap between 37 seconds and 5 seconds and to fetch those items in the cache, it took about, let's say, 6 seconds. So, a big difference again between 6 seconds and 30 seconds. So, this is how much of improvement the bulk operations can actually give you and your application and using this you don't need to run that same call again and again. You don't need to go to the clustered cache every single time. You can basically make a collection of all those operations that you need to perform, using the bulk API you can just add them into the cache.
Compression - Demo
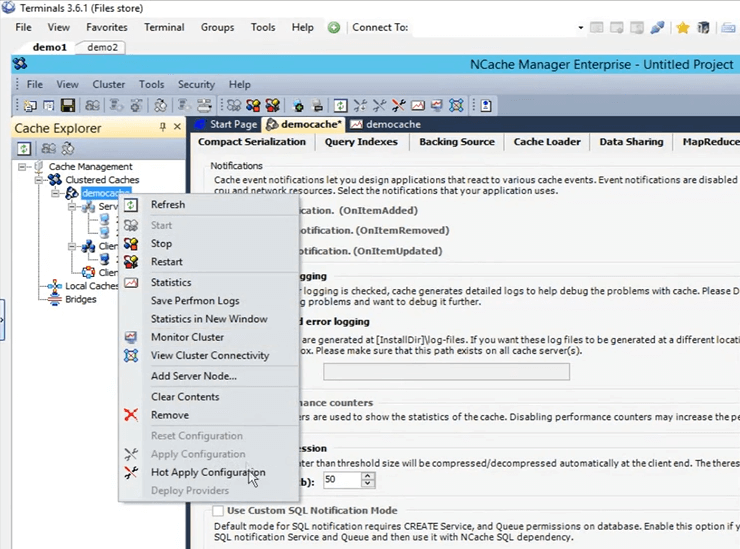
So, now our bulk test is actually done. So, go back to the presentation. So, the next one is the compression test. Again, as I mentioned earlier, we generally recommend breaking down the object into smaller size but if you do not have that option available, what you can do is you can actually compress, you can actually set a certain threshold. Any object greater than that wouldn't be compressed to a smaller size. Let's actually enable compression on our environment right now. So, first of all, let's go ahead and clear the cache. It's done. Compression is something that can be done on the fly. So, the cache does not need to be stopped. So, if I do a left click on the cache name, it’s going to open up all these different configurations. If I go here and I open up options here and what I need to do is just click on this enable compression. I'm going to set it to be 50 KB. So, anything that's greater than 50 KB is going to be compressed. Right click on the cache name and click on apply configurations. All these configurations are now going to be applied on the cluster. So, any object greater than that would actually be compressed.
So, I'm going to run the very same test that we initially did and that was test 1. Change it back to test 1, going to save this and I'm going to press on run (start). Let's wait for it to start and then I'll give some more details on to how compression actually helps in different scenarios. So, how compression is working, is that once the client is sending these items to the cache it is sending them as compressed. So, how compression helps is that, once the item is travelling over the network, it is of a smaller size and once it is staying in the clustered cache, it’s taking less location as well.
Kal, just wanted to remind you, we have 10 minutes before the session ends, so, just kind of pace yourself accordingly. Right, alright thanks. Any questions at this point? No, seems like everybody is good. Actually, we have two confirmations, so far so good, so, we're good. Alright, perfect. Thank you.
Okay, so, I was talking about compression how it helps. So, in the case there are two things, the whole network travel of a smaller size object is obviously going to be faster than of a bigger size and once that object is placed within the cache, click on Enter so that it starts retrieving these items. So, once it is placed within the cache, it's actually smaller as well. So, it's consuming less space. The whole time taken to process this item is also reduced. So, that's how compression helps within your scenario. There is an overhead involved on the client side while it is adding. But, the whole net improvement which we will notice right now is actually greater than that. So, the whole time it takes for, you know, the whole operations have been found on these items is actually going to be a lot faster. So, test 1 done with compression it took about 26 seconds.
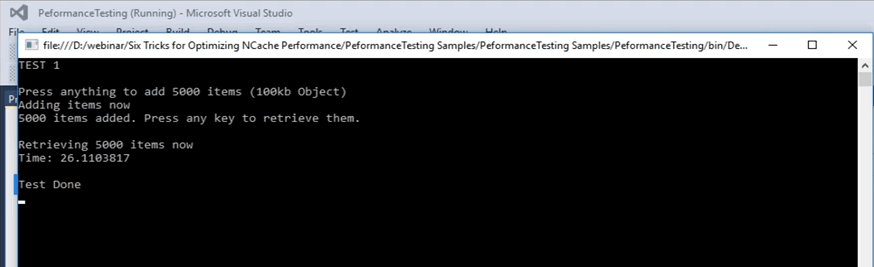
If you remember initially, in our first test with nothing, with no special features involved just the basic API it took, 45 seconds I believe. So, there's a big difference between 45 seconds and 26 seconds. So, that's how much compression actually helps, and if these operations are scaled out even more, there would be even a bigger difference in this case. So, that helps out a lot in this case.
Async Operations - Demo
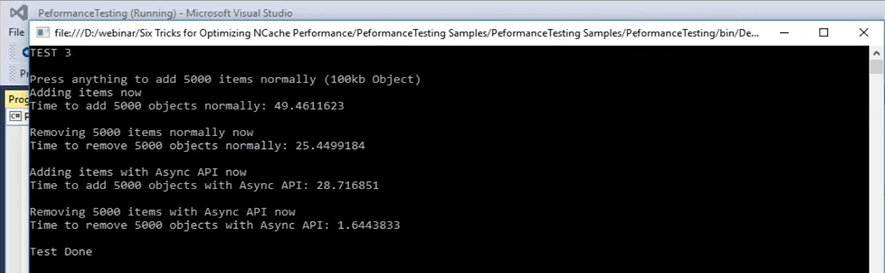
So, let's actually move on to the next scenario that we have, that is async updates. Async updates is basically your application does not wait. You can set up a separate task for it and that task is going to perform those operations. You can set up callbacks to just get the information if the item was added or it was not added for whatever scenario. You can actually set that up as well. I'm going to quickly go to the sample now and I think it is test number 3, but I can quickly confirm that. Okay, this is test number 3 for async updates. Let’s actually start it and then we can look into the details of the code. As soon as I can control back, I'm going to open up the code file and actually show you what is going on in test number 3 that is for async updates. Started now. So, in the async updates, that's test number 3, what's going on is that it first initially adds item into the cache using just the basic insert call and then once it's done adding those items, it basically removes them again in a part of a loop. So, each key is removed in a single iteration.
...
else if (args[1].Equals("test3"))//ASYNC API TEST
{
Console.WriteLine("TEST 3\n");
Console.WriteLine("Press anything to add " + objectsCount + " items normally (100kb Object)");
Console.ReadKey();
Console.WriteLine("Adding items now");

try
{
cache = NCache.InitializeCache(args[0]);
datetime1 = DateTime.Now;
for (int i = 0; i < objectsCount; i++)
{
cache.Insert(key + i, obj1);
//cache.InsertAsync(key + i, obj1, OnItemAdded, "", "");
}
...
I'm going to click on Enter. It's adding 5,000 items into the cache of size 100 KB and it's doing that normally. By normally here I mean just a simple insert and then it's removing those items with again in a part of the loop. So, using this we're going to see how much time it takes for this part and then afterwards we're going to be using the async calls for additions, async inserts and then for removing them. While it's adding these items, let's actually jump back and see how they look like. So, in this case, it's just doing a basic remove, to remove these items. In the async test part, what it is doing is, it's doing the insert async call. So, the client does not wait, just passes the operation onto the queue. The queue does not mean that it's going to be a slow process, the client does not wait for it and it's done as a pretty, you know, in as a background process but it's done pretty fast. Because, a lot of operations within the cache are actually done in an async manner.
...
datetime2 = DateTime.Now;
Console.WriteLine("Time to remove " + objectsCount + " objects normally: " + (datetime2 - datetime1).TotalSeconds);
Console.WriteLine("\nAdding items using Async API now");
datetime1 = DateTime.Now;

for (int i = 0; i < objectsCount; i++)
{
//cache.Insert(key + i, obj1);
cache.InsertAsync(key + i, obj1, OnItemAdded, "","");
}
datetime2 = DateTime.Now;
Console.WriteLine("Time to add " + objectsCount + " objects with Async API: " + (datetime2 - datetime1).TotalSeconds);
Console.WriteLine("\nRemoving " + objectsCount + " items with Async API now");
...
Let me give you an example. So, for example, if replication is talked about, if you remember in the cache creation process we set it to be async. So, using that basically a lot of them are done as a background process. They're very reliable. It's just that your application, the main process, the main task is not affected by it. So, it has added those items into the cache took about 49 seconds to add those items into the cache. Now, it's actually removing those 5,000 items. Now, once that is done we're going to see how the async calls take. So, it has to move 5,000 items. Took about 25 seconds to remove those items and now it's adding items with the async call and we're going to see how much difference that we get between 49 seconds and the number that we're going to get now in terms of when we're adding items into the cache. There it is. So, from 49 seconds it was dropped down to 28 seconds in the additions part and in the case of removing those items it dropped down from 25 seconds to 1.6 seconds. So, that's how much performance that we can actually see once you have this involved. So, you can see that there's a big difference. It’s about 25 seconds difference between removing items from a basic remove call and then from a remove async call. So, that's something that you can expect from these sort of features that are offered by NCache.
Dual NICs - Demo
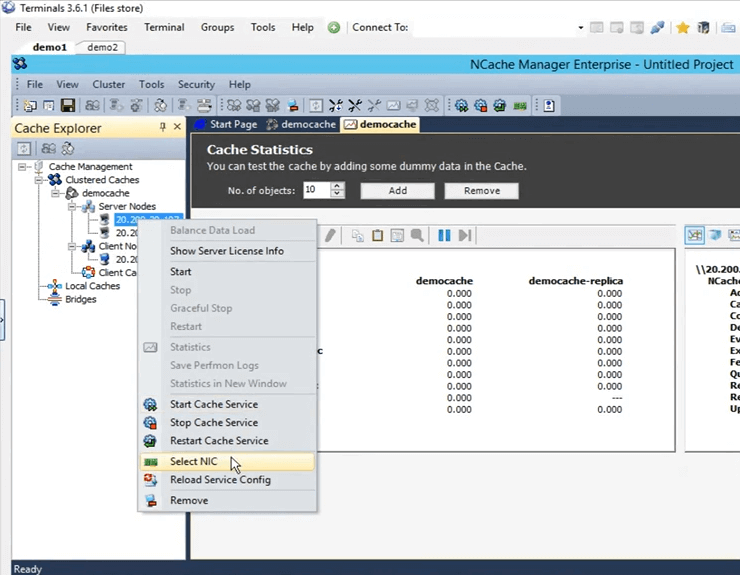
Let's actually jump back to the presentation. We've covered async and the next one is compact serialization. So, again, just this is covered in those scenarios where you don't have the luxury to do an update within the code and using this you can actually mark all those classes as serializable. Kal with that comment, we have about 3 minutes left, so… Right, right. I'm just going to quickly cover it up. So, the last two things that were left was, the one is compact serialization and the after that is we have the dual NICs feature. So, as I mentioned earlier, if you see that your network resource is being maxed out, by default both the sort of communication, server to server communication and client to server communication, both would be happening on the very same network interface card. But, if you see that your network resources are being maxed out, what you can do is, you can separate out the kind of the communication between client to server and then from server to server communication. It's a very simple task within the NCache manager. If you come here, to select it, just right click here and click on select NIC.
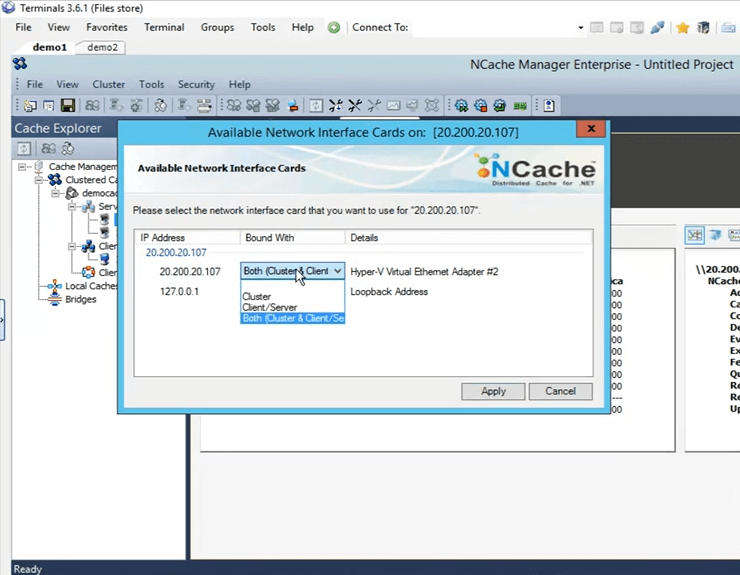
Once you select NIC, you can actually specify which communication that you want to take place on this certain IP. Since, I have only one, I have these options available. If I have multiple IPs I can actually select that right there and then. So, I am just going to click on cancel.
We didn't get a chance to do the compact serialization demo because of shortage of time but I can actually share this sample out with you guys and you can test it and see how that works for you. Sam over to you. Perfect. Well, thank you very much for your time Kal.
Are there any questions before we wrap up today's session? I'm just going to give a minute to see if there are any questions. Ok, so, there is a question.
Can you please share the link where you're going to be sharing this presentation? So, Kal, I guess it would be available on our website, right?
Yes, it is going to be available and I have their email noted down there. So, what I can do is, I can send them an email, as soon as it gets uploaded. Ok. Actually, we have another question.
Can we schedule a presentation, ok, so, can we schedule a demo for our team?
Yes, absolutely. You can certainly schedule a demo. You can contact our support team support@alachisoft.com or our sales team sales@alachisoft.com and just let us know what your time preferences and we'll be more than happy to schedule a personalized session for you.
Okay, Kal so I'm going to go ahead and wrap this up. I don't think we have any more questions. Thank you everybody for joining and attending the session today, we appreciate it. Like I said, if you have any questions, please reach out to our support team or for sales related questions reach out to our sales team. We'll be here to help. Feel free to give us a call. You can reach us directly via phone as well. It's on our website. Until next time, thank you very much and have a good evening, bye.