Use NCache with Azure Service Fabric
Hello and welcome to another presentation of NCache. Today, we are going to be talking about how we can deploy NCache into a Service Fabric environment. There is a lot to cover, so let's get started.
NCache Deployment
Let's start off with a general overview of what we are trying to achieve. So, here we have a bird's eye view of a typical Service Fabric application deployed to Azure.
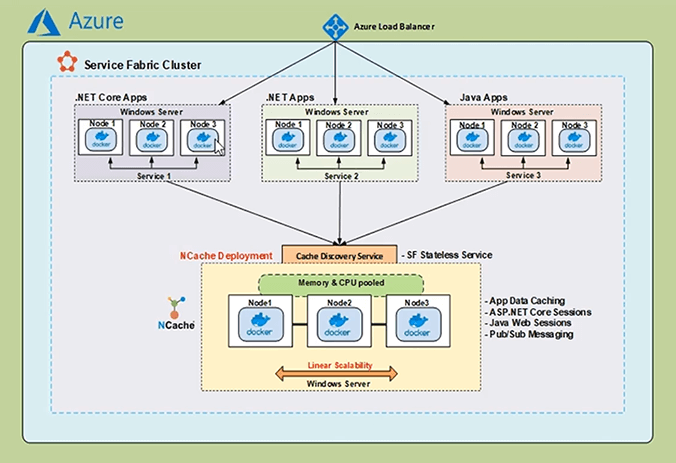
We have a Service Fabric Cluster that has an Azure load balancer. Within the Service Fabric application, we have a number of services that could be written in different languages. These services are typically deployed as containerized services. Now in an Enterprise application, distributed caching is important for enabling high read performance and that is where NCache comes in.
NCache can be deployed within the Service Fabric application as a containerized service. NCache server is running within the containers on the multiple nodes of the Virtual Machine scale set, can communicate with one another and form a clustered cache. Bridging the gap between the NCache clients and the servers, we have the Cache Discovery Service, which is used to get the real-time IP address information of the NCache servers and furnish that information to the NCache clients. With this information, the NCache clients can then create cache handles, with which they can start performing cache management and CRUD operations on the NCache Clustered Cache.
So, the following are the main parameters of the demonstration we're going to go into half today.
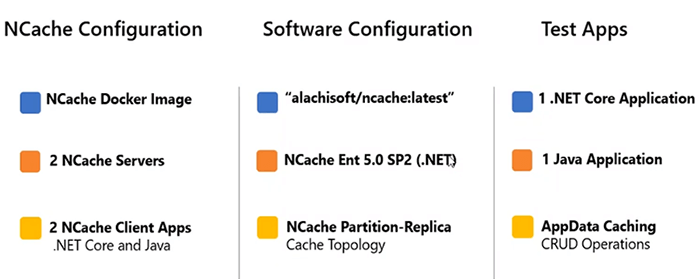
The NCache servers that are running within the Windows containers will be using the Docker Image with the name of ‘alachisoft/ncache:latest’. This contains the NCache Enterprise, with a .NET framework installation. We will start off with 2 NCache servers, that are brought together to form a clustered cache with a partition of Replica topology. The two NCache client applications we have are written in .NET Core and Java and they will perform CRUD operations on the NCache servers.
Create Service Fabric Cluster
So, to get started the first thing we will do is create a Service Fabric infrastructure on Azure. I can come over to my browser window, where I have already opened my Azure Portal.
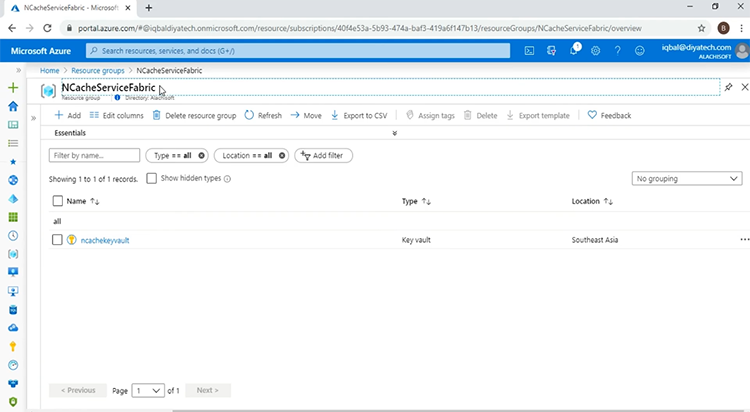
I have created a Resource Group with the name of ‘NCacheServiceFabric’ and this, at the moment contains only a single ‘Key vault’ resource. This Key vault resource contains the certificate that will be used with the Service Fabric Cluster. Coming over to Visual Studio 2019, I have an ARM Template open and have introduced settings, to allow for the Service Fabric open configuration mode.
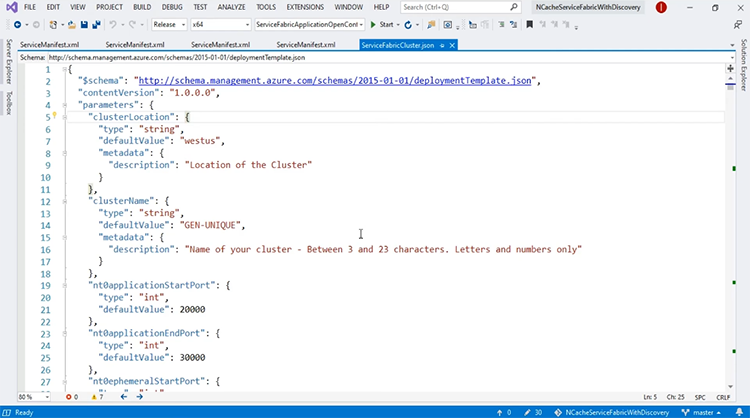
We will talk more about Service Fabric open configuration mode and why we are using it after we have deployed the infrastructure. So, to get started with the deployment, I can come over to ‘Solution Explorer’ and on my Azure resource group project, I can right click, come to deploy and I have listed the resource group.
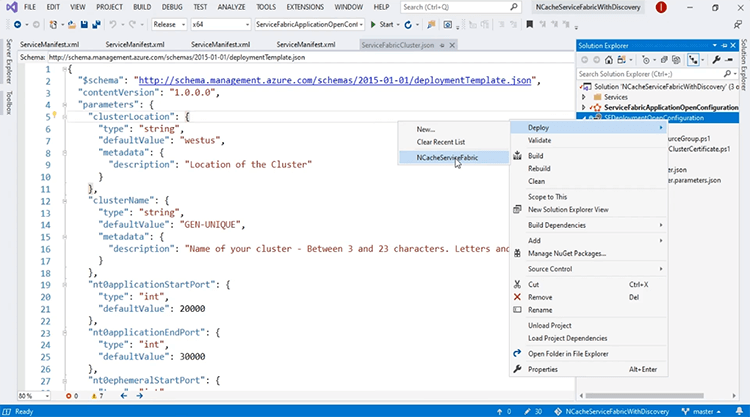
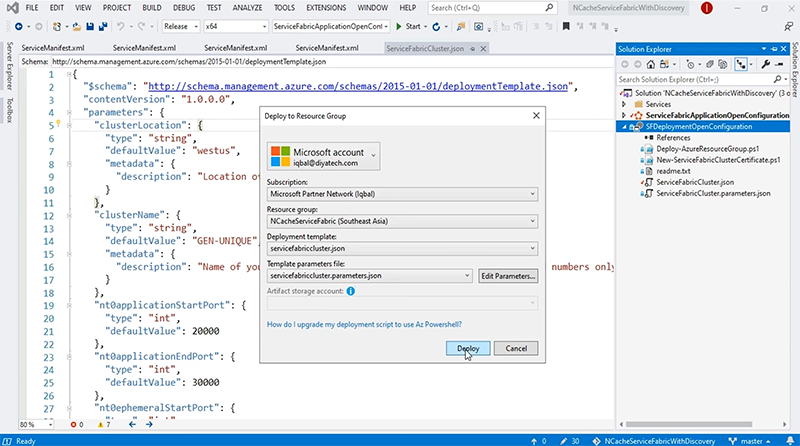
This will open a deployment window. I can click the ‘Deploy’ button and the deployment will start.
This will take some time, so, I'm going to pause the video here. Our template has been successfully deployed and to confirm this we can come back to our Azure portal. If I refresh the page, you will see changes and here we do. So, now our Service Fabric Cluster and all the associated dependent resources have been successfully created. To get started, the first thing I'm going to talk about is the open configuration mode, that I touched upon before.
This article basically goes over the open configuration mode and why it is used. For our purposes, open configuration mode allows for the NCache servers that are running within the containers to actually be able to communicate across multiple hosts and come together to form a clustered cache and to see how this is done, we can come to the Azure portal and the first thing I will look at is the Virtual Network.
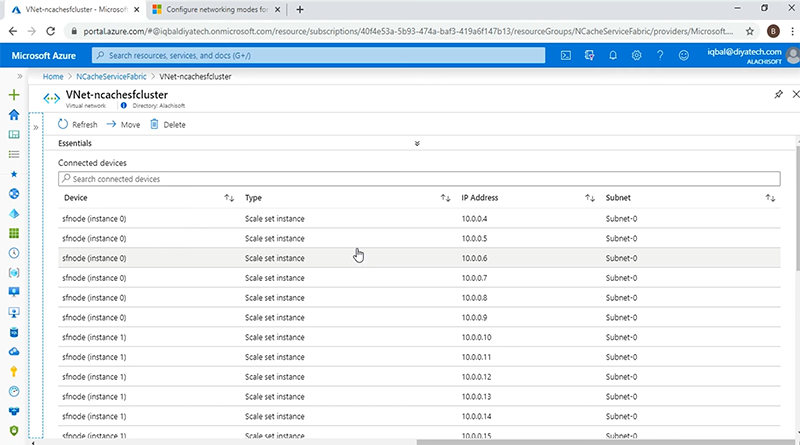
Okay so, now we have multiple nodes from the virtual machine scale set but if you look closely, each of the nodes has multiple IP addresses assigned to them. The first IP address is the primary address for the host. However, the other IP addresses that are attached to the node, form the secondary IP address pool and with the open configuration mode of Service Fabric, these IP addresses will be assigned to the containers, on which the NCache servers will be running. With the IP addresses assigned from this secondary pool, the containers in the multiple hosts can communicate with each other seamlessly to create a cache cluster on Service Fabric.
The other thing I want to look at in the resources is the load balancer and if I come to the ‘Frontend IP configuration’, the rule I am actually interested in is ‘Rule 10’ and this has to do with the port 8251, which will be used by the NCache Web Manager, that we will talk about later on in this presentation. But the important thing to note is that with the NCache Web Manager, we are going to be using a sticky persistence as can be seen by the ‘session persistence’ fields shown here, with a value of ‘Client IP’.
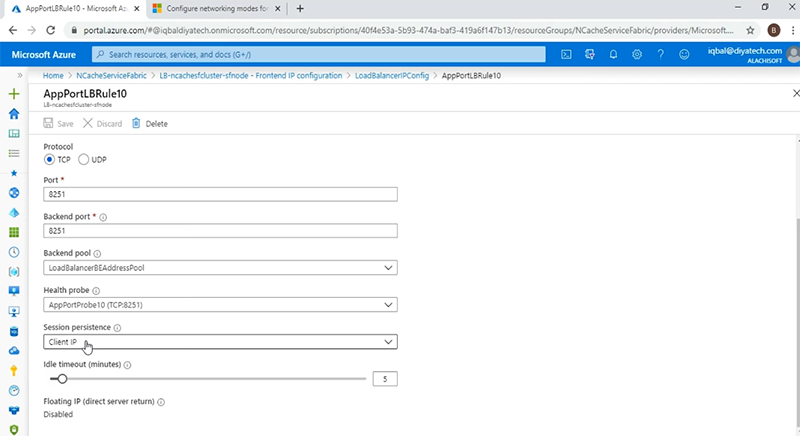
With this, if there are multiple instances of NCache Web Manager running, we will be able to have a consistent user experience between the browser and the end service. Now that we have looked at the infrastructure and deployed it successfully, we are going to go into the deployment of the Service Fabric application and for that, we'll come back to Visual Studio and we have a number of ServiceManifest files, corresponding to the services of the application. We have the NCache service, the NCache Web Manager service, the Discovery Service as well as the client container service, that will house our client applications. We will go into the details of each of these services, after we have deployed the application. To do that, we'll come back to a solution explorer and over here we'll just right click on the Service Fabric application project and name and coming down to ‘Publish’.
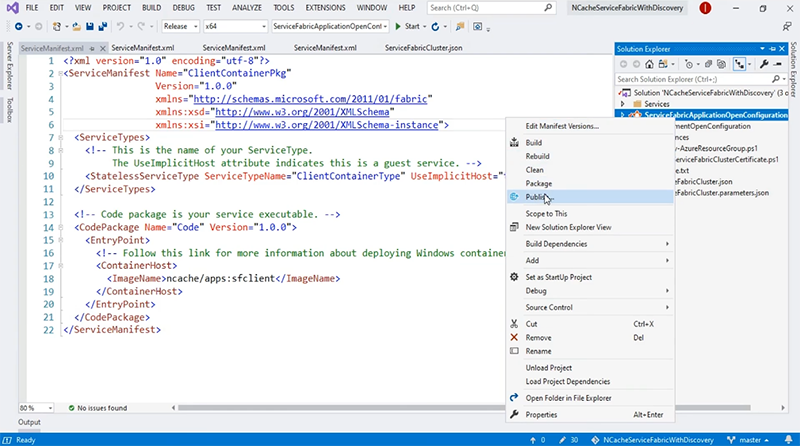
This will open up our deployment window and as you can see it has already picked up the Service Fabric Cluster connection Endpoint. All we have to do at this point is to click ‘Publish’ and the process will start.
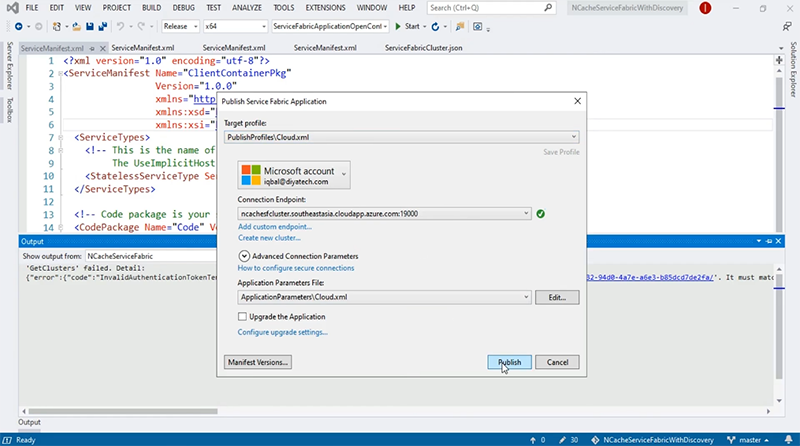
This will take some time, so I'm going to pause my video here. The application was successfully deployed and we are ready on the ‘Service Fabric Explorer’ window. As you can see the cluster DNS is given over here.
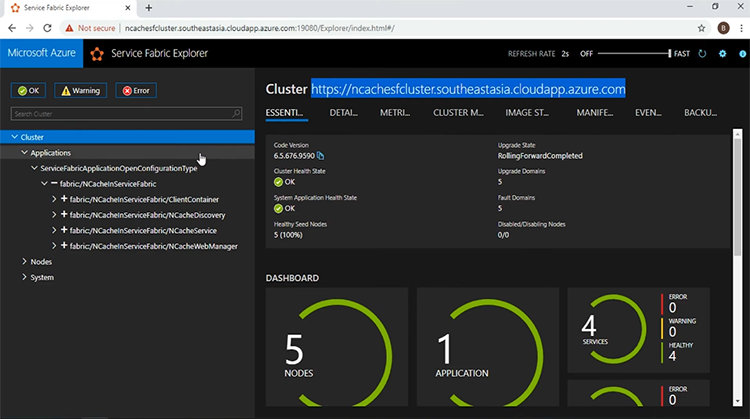
And if I go and see at the ‘DASHBOARD’, I have five nodes up and running with 1 application and 4 services. The 4 services can be seen in the left pane. The first service that I want to look at is, the NCache service. This represents the NCache servers that will be running within the containers and which will form the clustered cache. Then I have the NCache Web Manager service, this represents an easy-to-use GUI for a cache cluster Creation and Monitoring. Then I have the NCache Discovery Service, which will be responsible for acquiring the IP addresses of the NCache servers and furnishing them to the client applications. Speaking of the client applications, we have the client container service which represents a container that houses two different applications, one written in .NET Core and the other in Java. Now I will go into the details of each of these services in turn.
NCache Cluster Service
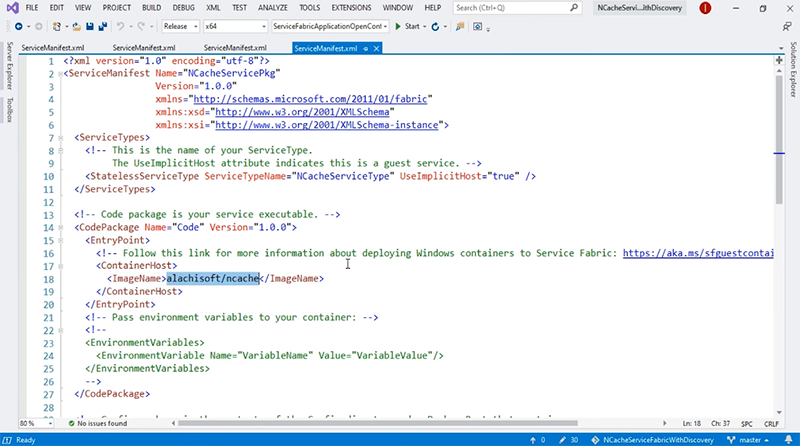
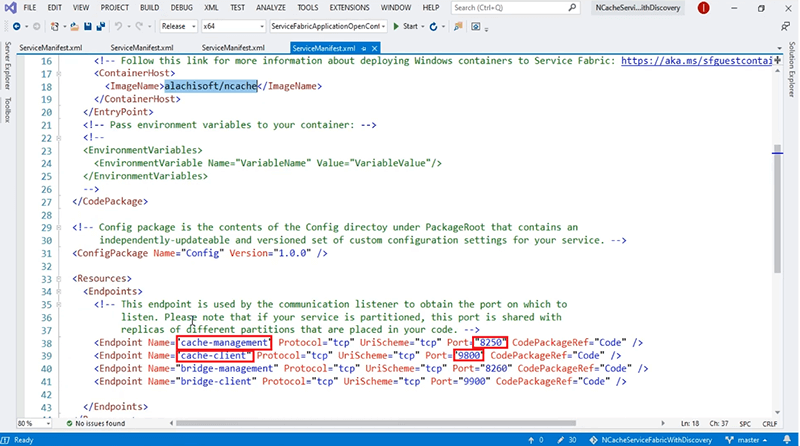
The first one I want to look at, is the NCache Cluster Service and for that I'm going to come back to Visual Studio. This is the ServiceManifest for the NCache Cluster Service, as you can see it is a container service, that uses the image ‘alachisoft/ncache’.
There are a couple of Endpoints, that I registered with the naming service and these are as follows: We have the ‘cache-management’ endpoint, that exposes the port 8250, on which the cache servers will be listening for connection requests. We have the ‘cache-client’ endpoint which is, exposing port 9800. All the CRUD operations are performed through this port. Besides these, we have the ‘bridge-management’ and the ‘bridge-client’ Endpoints as well. For this present demonstration, we are only going to be concentrating on the first two Endpoints shown over here.
NCache Management Service
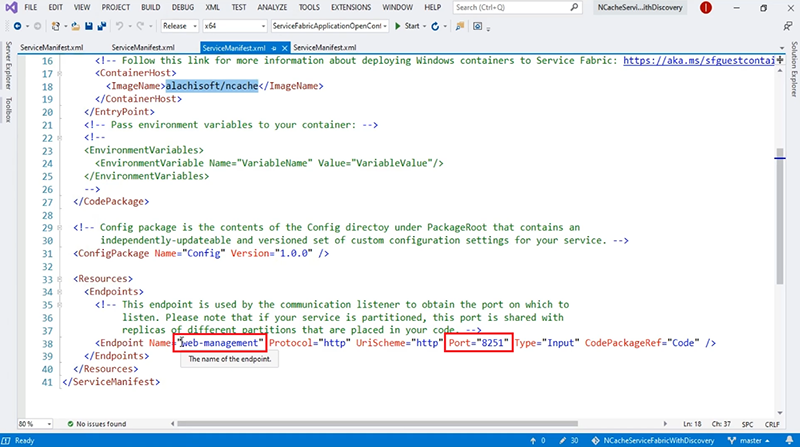
The second service that we look at, is the NCache Management Service, that represents the Web Manager GUI. Coming back to Visual Studio, if I come to the ServiceManifest for the NCache Web Manager Service, we see that it is also a container service that uses the same image as the NCache service and the Endpoint that we register with the naming service is ‘web-management’ and which exposes port 8251.
NCache Discovery Service
The third Service is of course the NCache Discovery Service and the ServiceManifest for that is given here.
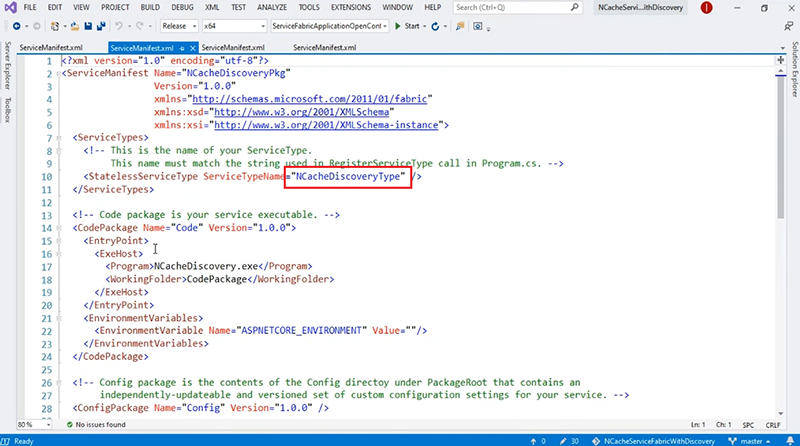
The NCache Discovery Service is a stateless, reliable ASP.NET Core Web API. Which consults with the naming service and acquires the Endpoints that were registered by the NCache service given here. With the Endpoints received from the naming service, the Discovery Service can then furnish that information to the NCache clients.
Client Applications Services
The fourth service we have in our application, is the Client App Services and for that as well we have these ServiceManifest open and the Client Applications, the .NET Core and the Java are housed within the same container. The image of which is ‘ncache/apps:sfclient’.
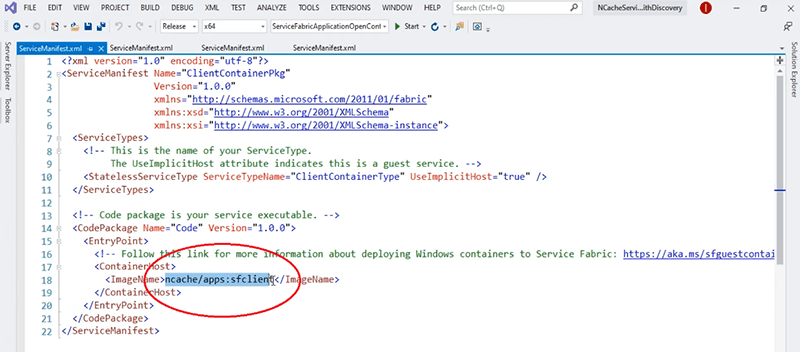
The important thing to note here is that, with the NCache service and client service, we are using ‘open config’. The NCache service has the open config mode, to allow for the containers running on different hosts to communicate with one another and thus form the cache cluster while on the client container we have a NCache client and installation which will be used by Web Manager GUI to acquire the client-side counters and be able to monitor the client behaviour from the GUI.
Create Cache Cluster
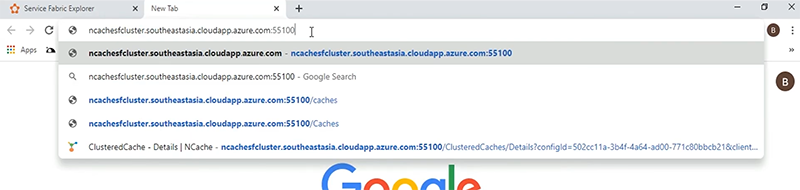
The next part to do is, the actual creation of the cache cluster and for that let's go back to our Service Fabric Explorer window. The first thing I'm going to do is, confirm that my Service Discovery is working. For that, I will give in the URI, which is made up of the clustered DNS and the port on which the Discovery Service is listening, which is 55100.
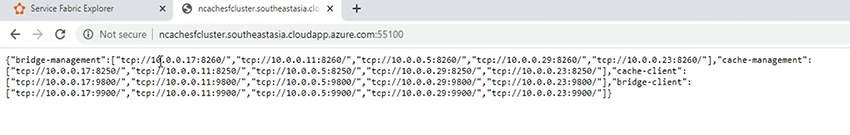
If I click enter, I see that the IP addresses and the associated ports for each Endpoint that were registered by the NCache service, have been successfully presented. If you look closely, the IP addresses are the same, as given by the Virtual Network to these Service Fabric nodes, as part of the secondary IP pool.
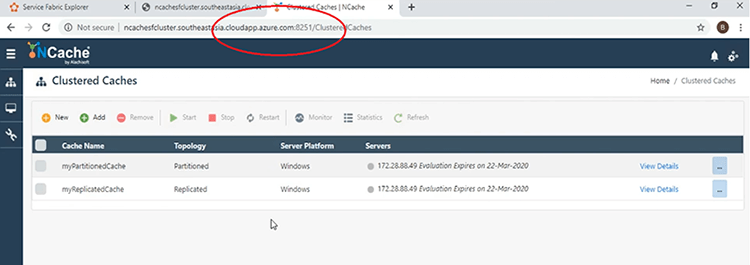
Now that we have the Service discovery running, let's go and come to the NCache Web Manager. Again, we'll give in the Clustered DNS, followed by the port on which it is listening, which is 8251 and this brings us to the main window of the Web Manager GUI.
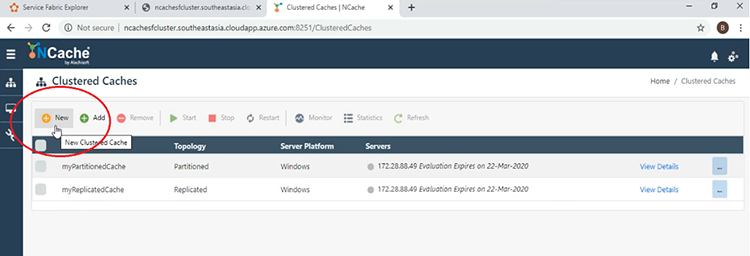
Now I'm going to demonstrate how easy it is to create a clustered cache and for that all I need to do is click the ‘New’ button shown here.
I will start off by giving the name for the cache.
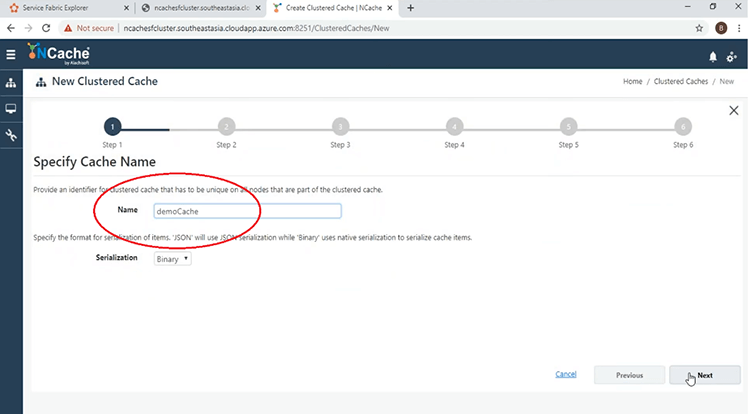
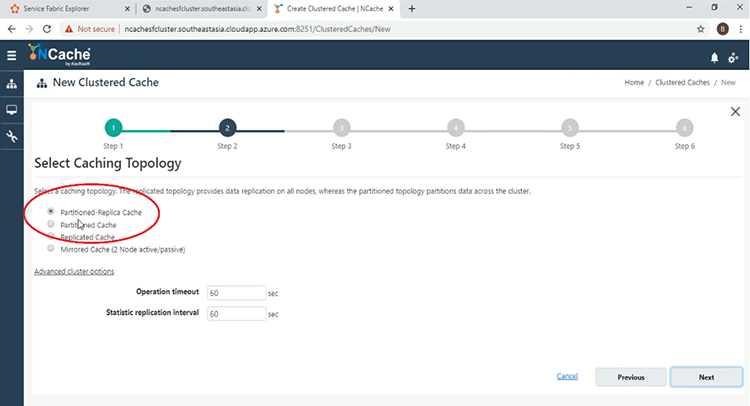
Keep everything else default. I will use the partition of Replica topology with asynchronous mode.
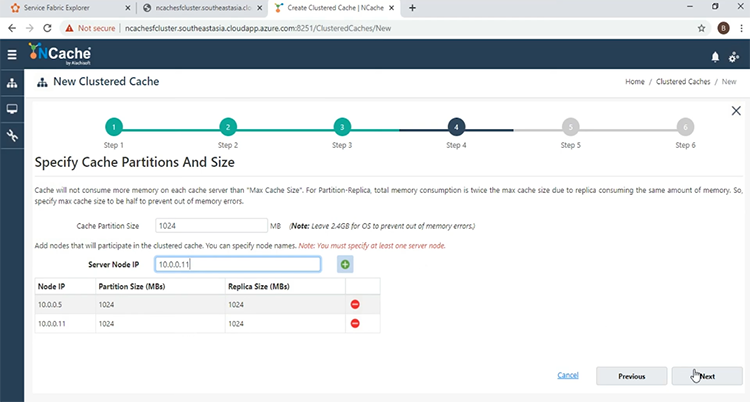
Now at this point I'm going to give in the IP addresses of these servers that will make up my clustered cache. So, first I'm going to give the first IP and the second one 11. With these two added, we can come to the next phase.
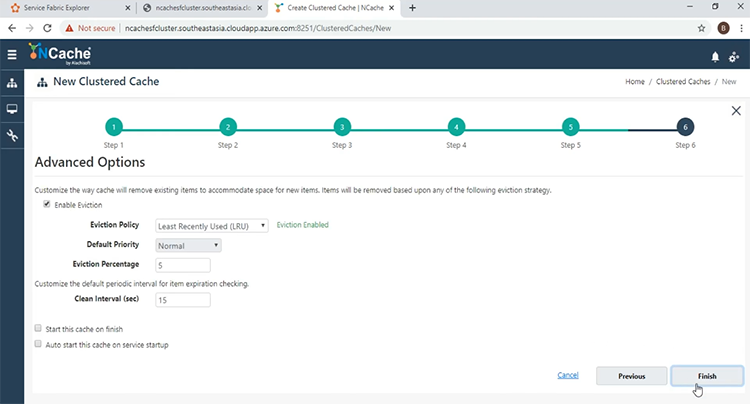
Keep everything else default and at the end we just click ‘Finish’.
The Cache will be created, as can be seen on the main window.
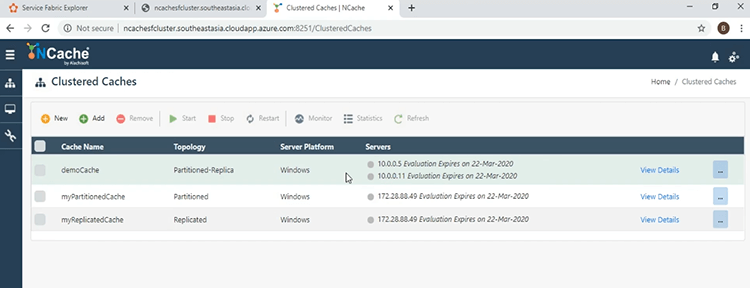
Now that it is created, it's time to start it and for that we can click the check box next to the name of the cache and then press the ‘Start’ button.
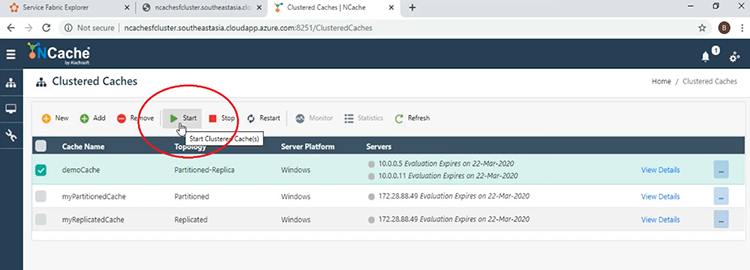
Now that the cache has been started, there are a couple of things we can look at right now. The first thing we can do is, look at the ‘Monitor’ tool by clicking on the ‘Monitor’ button, while the checkbox is pressed.
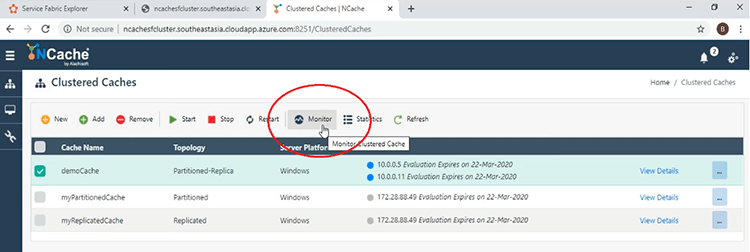
This will open another window and we will be able to see the dashboards that make up our Monitoring Tool. The first thing you can look at over here is the ‘Cluster Health’. We see that we have 2 servers, with the Active and Replica Partitions, are fully connected, as can be seen by the green color.
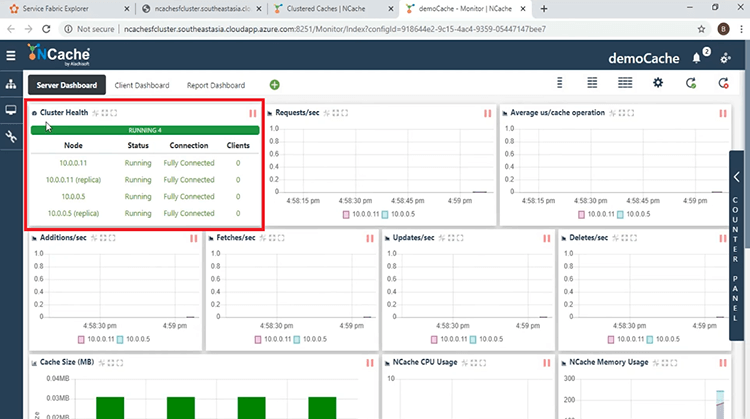
We have the four different partitions shown in a graphical format here as well.
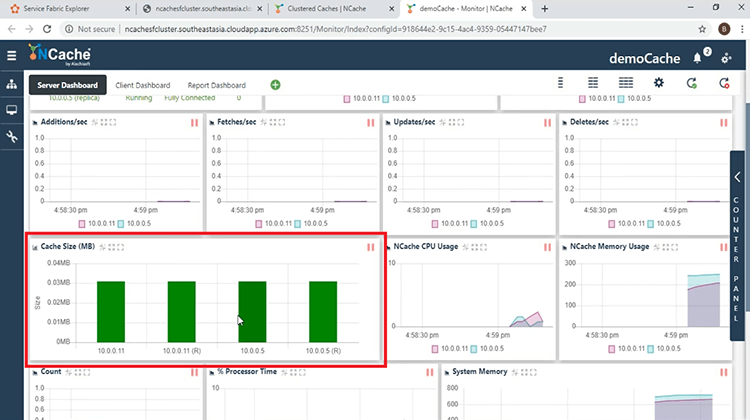
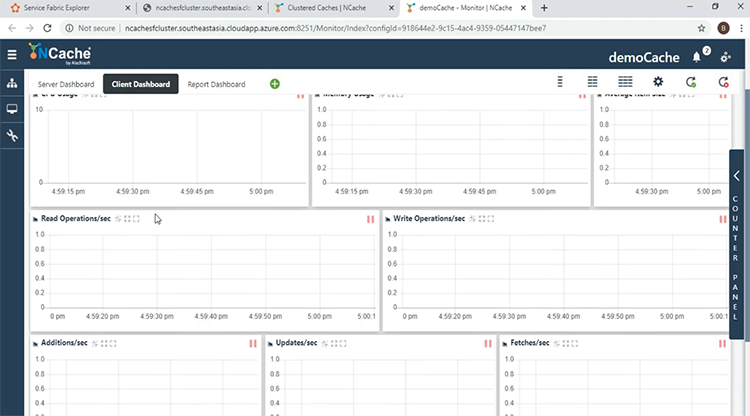
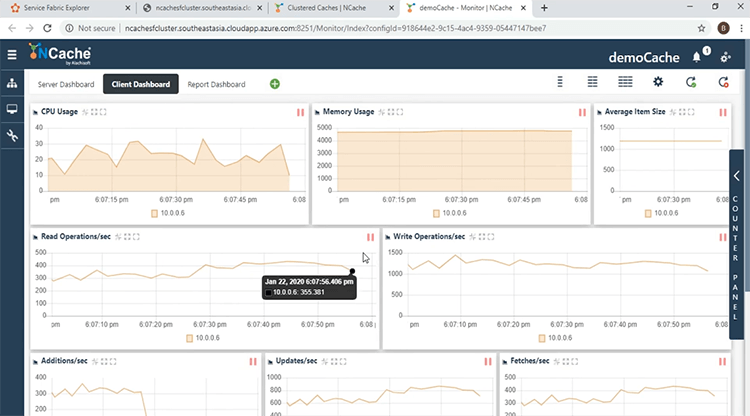
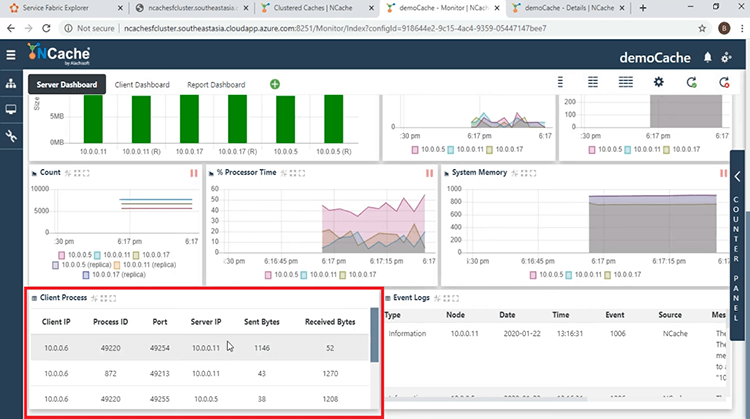
There are a couple of counters we can look at right now, including the ‘Requests/second’ the ‘Additions’, ‘Fetches’, ‘Updates’, ‘Deletes’ etc. The ‘Count’ is 0, along with all the other CRUD operation counters because there are no client processes connected as yet and the client processes once connected can be seen from the ‘Client Process’ dashboard, which will show the ‘Client IP’, the ‘Process ID’ and which server it is connected to. This is the ‘Server Dashboard’. The other dashboard that's available by default is the ‘Client Dashboard’ and here we can look at the different counters, coming from the clients and be able to diagnose and monitor the client behaviour.
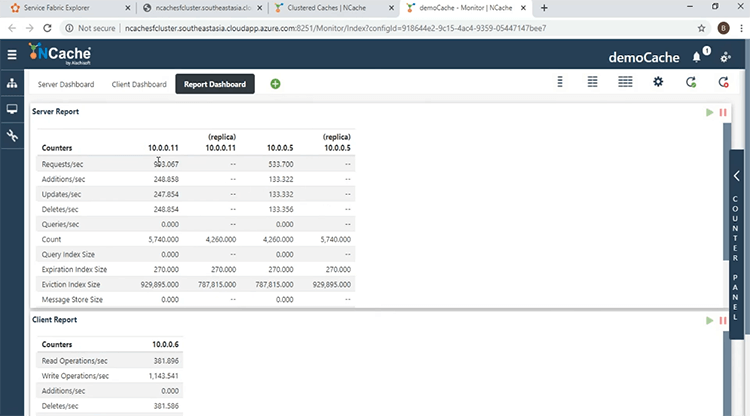
The third dashboard that comes by default is, the ‘Report Dashboard’, that shows an overall view of both the server and the client-side performance counters.

Run Client Applications
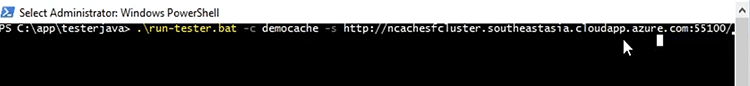
To see the information in action, we will now start the client applications. So, now we get to running our client apps. Coming back to the monitor window, I have here the PowerShell open within the client container and I'm already within the ‘nettester’ folder, that contains the binaries for the .NET Core App. I will run a batch command that takes as parameters, the name of the cache, which is ‘democache’ as well as the URI of the Cache Discovery Service as shown over here.
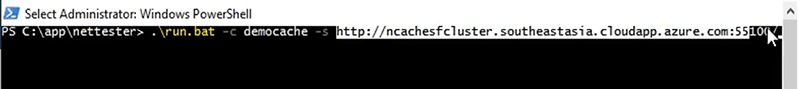
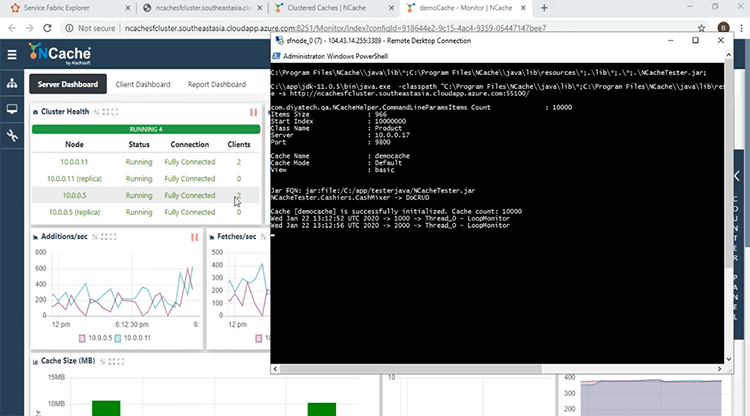
It's made up of the clustered DNS, as well as the port of the Cache Discovery Service. Now, if i press ‘Enter’ the cache will be initialized from the client side and we will be looking at some activity on the monitoring window. So, without further ado and here we see that the client has been successful in getting the IP Addresses and the cache handle has been initialized and this can be confirmed from the cluster health monitor, which shows that the number of clients has increased by one.
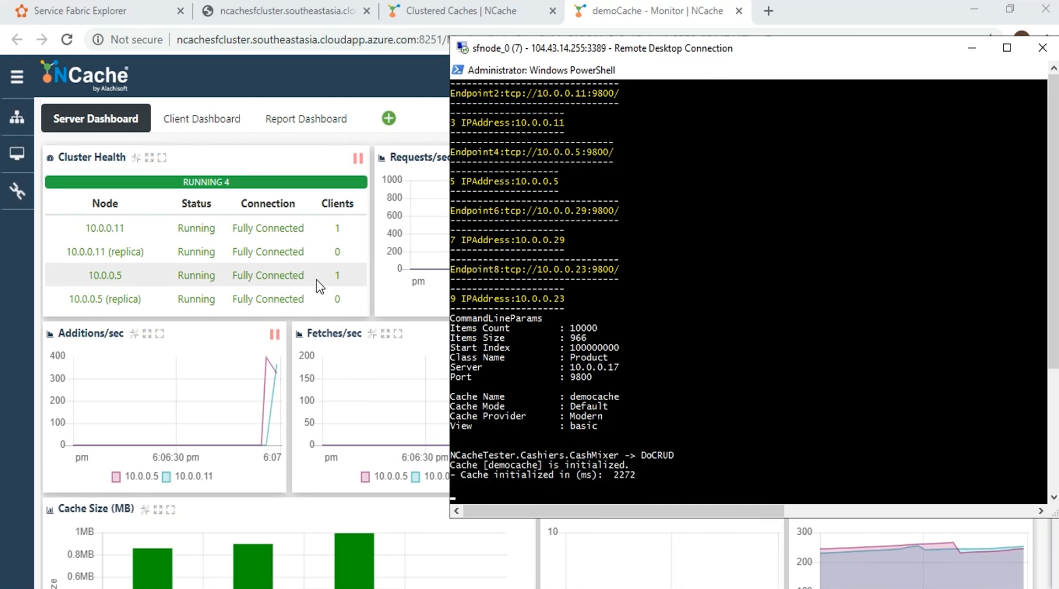
We also start seeing some activity on the different dashboards that is associated with the CRUD operations. Such as the ‘Additions’, ‘Fetches’, Updates’ and ‘Deletes’. As well as the overall activity being shown with the ‘Requests/sec’. We see that the ‘Count’ has started increasing as the Client has started putting items into the cache and we see in the ‘Client Process’, new entries related to the client process. We see the ‘Client IP’ and the ‘Process ID’ and we see that the client is connected to both servers. This is a feature specific to the partition and partition of Replica topology known as being cluster aware. Coming over to the ‘Client Dashboard’, we see some activity here as well and we can see that the Web Manager has been able to get the counters from the Client-side.
The ‘Report Dashboard’ gives an overall view. We see that the per node instance of the performance counters are being shown here on the servers and we also see the activity on the ‘Client Report’ side as well coming from the Client-side.
Now that we have been able to successfully connect from the .NET Core Client, we will now try to connect from the Java Client as well. So, just like with the .NET Core Application, we have a batch file that runs the Java Application here. Again, it takes the same parameters namely the name of the cache as well as the URI of the Cache Discovery Service.
Now I will run the program and look at what changes in the monitoring window. So, I press ‘Enter’ and the Application has started and it has been successfully initialized and we see now that there are now 2 clients connected to each of these Servers.
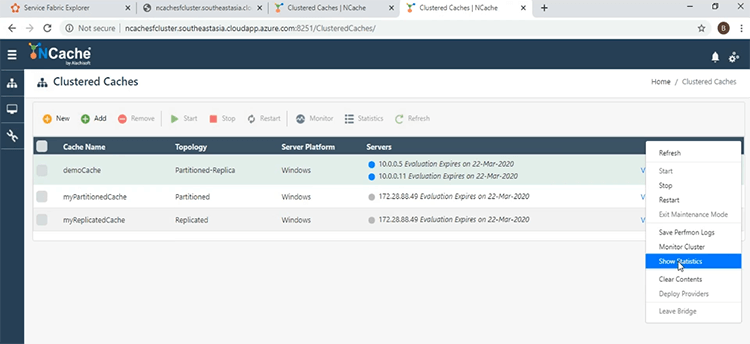
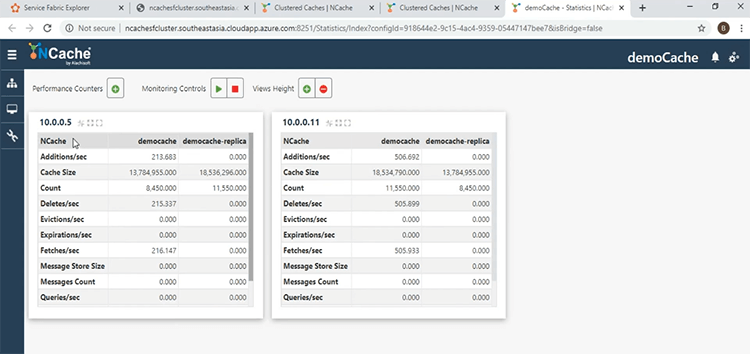
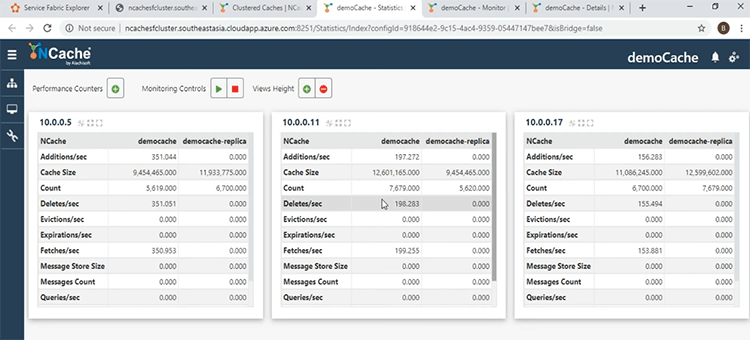
Coming over here, let's look at what the activity is showing. First of all, let's look at the ‘Count’. The ‘Count’ has started increasing, because the number of clients has increased and they're both dumping data into the cache. The requests have started increasing as well, the rate of them and over here in the ‘Client Process’, we see that there are 2 clients shown over here. Since they are running from the same container, the client IPs are the same but the process IDs are different and one coming from .NET Core and the other from Java. If I come over to the main window another window, I want to show is the ‘Statistics’ window. Which gives another view of what's going on? To do that, I will click the ellipsis button and come over to the ‘Show Statistics’ tab.
We see here the per Node performance counters in this window as well. The IP addresses are shown here. So, we have been successful in connecting our clients to our servers all within the same Service Fabric Cluster.
Scaling NCache Cluster
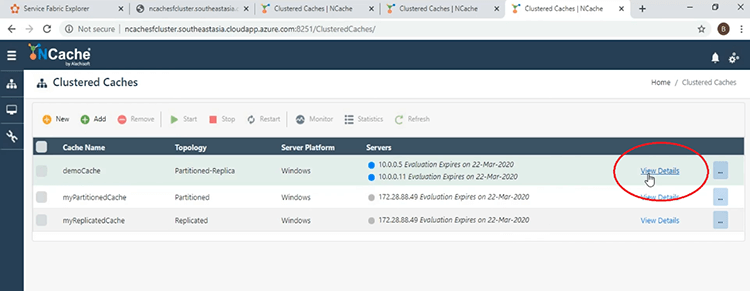
In this last part of the demonstration, we are going to demonstrate the runtime addition of Nodes to the Clustered Cache and we will see that additions has no impact on the performance of the Client Applications. For that, let's come back over to our main window in the ‘Web Manager’. To add a third Node all we have to do is click on the ‘View Details’ link as shown over here.
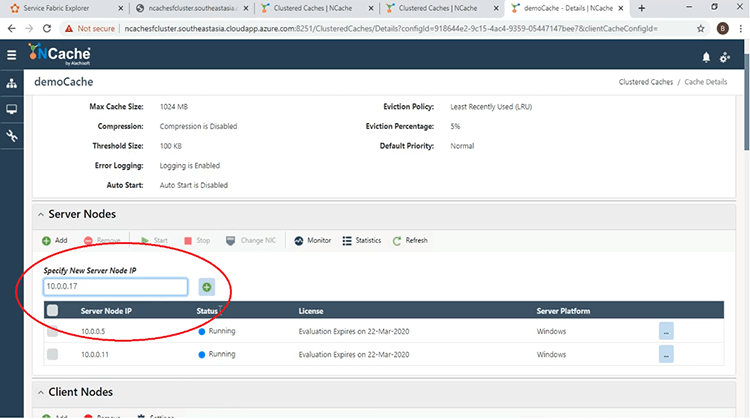
This will bring us to another window and if we come to the Server Nodes section, to add a third Node, all we have to do is click on the ‘Add’ button shown here.
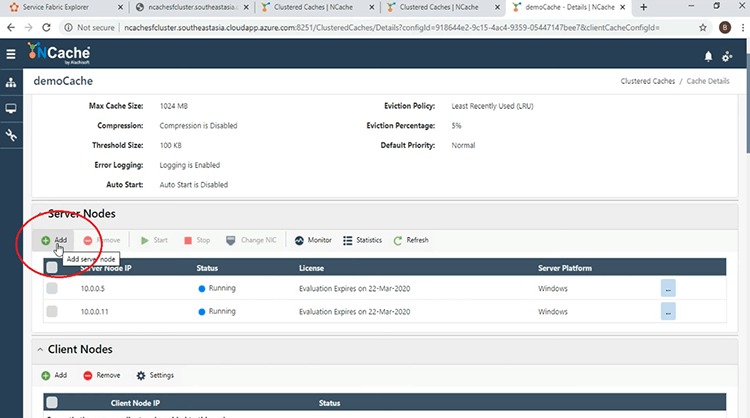
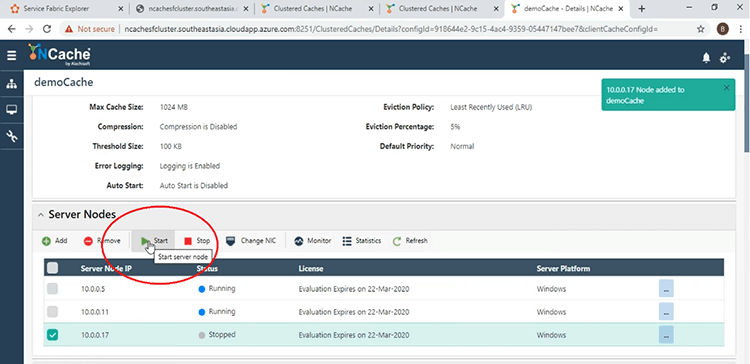
Give the address of the third Server. I will do that here and I will give the one with 17 and the Node was successfully added.
Now that is added, we have to start it and for that we just click the checkbox next to the IP address and click ‘Start’ and it has been successfully added.
Coming back to the main window, if we refresh this button, we see now that there are 3 servers and now let's look at what happens at the monitoring window. Same as before, we click the check box here and click on the ‘Monitor’ tab and now we see that there are 3 servers shown in the ‘Cluster Health’ dashboard and is fully connected.
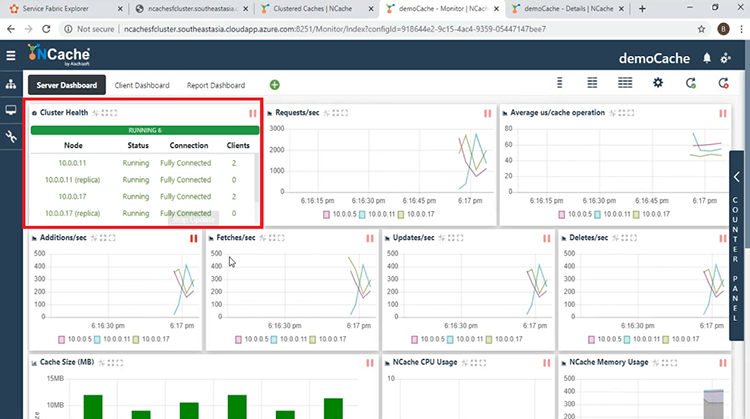
And in the ‘Client Process’, we have 3 different servers furnishing the request from the 2 clients.
And if you look in the ‘Count’ section, the ‘Count’ has been load balanced among the 3 Nodes.
This shows that the load balancing strategy employed by the partition of Replica Cluster is in effect.
This brings us to the end of our presentation. We have looked at how we can deploy NCache as a containerized service within a Service Fabric Application. If you have any question about NCache or the presentation that you have just witnessed, please don't hesitate in contacting us at support@alachisoft.com. Thank you.