A cache cluster is a group of interconnected server nodes that work together to store and manage frequently accessed data for distributed applications. Such clusters are critical for scenarios where high performance and scalability is a necessity, where even slight delays result in significant financial losses. Therefore, effective cache cluster management ensures that data is readily available under peak loads.
NCache offers an admin console for managing its cache clusters known as the NCache Management Center. It provides a user-friendly graphic interface that allows applications to configure caches and monitor performance with ease. This blog will guide you through using this tool and the process of managing your cache cluster with NCache.
Key Takeaways
Centralized Management: Use the web-based NCache Management Center to handle all cluster operations. This includes everything from initial creation to real-time monitoring through a single graphical interface.
Flexible Scaling: Dynamically add server nodes to your cluster via IP address to increase application capacity and ensure high availability.
Optimized Serialization: Select between Binary or JSON formats during configuration. Binary is optimized for high-performance .NET environments, while JSON provides cross-platform compatibility.
Performance Validation: Use the integrated Test-Stress tool to simulate heavy transactional loads and verify how your cluster behaves under peak demand.
Deep Diagnostics: Monitor health via graphical dashboards and granular PerfMon counters to track memory usage, request rates, and node connectivity.
Granular Node Control: Manage the entire cluster globally or take specific actions (Start/Stop/Restart) on individual server nodes for targeted maintenance.
Prerequisites
Before proceeding, ensure that the NCache Service is running. On Windows,
- open the “Task Manager”.
- Navigate to the “Services” tab.
- Look for “NCacheSvc” in the list.
If it’s not running, restart it by right-clicking on the service and selecting “Start” from the drop-down menu. Alternatively, you can start it via the command line using:
|
1 |
Start-Service -Name NCacheSvc |
For .NET Core, you will have to run NCacheSvc as an Administrator.
Essential Management Features
Before diving into the step-by-step configuration, the following table summarizes the primary management operations and features available within the NCache Management Center:
| Feature/Operation | Supported Options | Key Purpose |
|---|---|---|
| In-Memory Store Types | Distributed Cache, Distributed Cache with Persistence, Pub/Sub Messaging | Determines how data is stored and replicated across the cluster. |
| Serialization Formats | JSON or Binary | Optimized for either cross-platform use or maximum performance. |
| Server Management | Add/Remove Server Nodes (via IP) | Increases cluster capacity and ensures high availability. |
| Cluster Controls | Start, Stop, and Restart (All or Specific Nodes) | Provides granular control over node status during maintenance. |
| Performance Tools | Test-Stress and Monitoring Dashboards | Evaluates behavior under heavy loads and tracks real-time health. |
| Advanced Settings | Encryption, Compression, and Eviction Policies | Enhances security, storage efficiency, and data management. |
Configure Clustered Caches
This section highlights several features available via the NCache Management Center to facilitate the easy cluster configuration. However, it is also possible to implement some of these configurations through command-line tools like PowerShell. NCache is available for both Windows and Linux platforms. This blog will focus only on Windows.
How to Create a Clustered Cache in NCache?
You can create a new clustered cache in NCache using the NCache Management Center, as detailed below:
Launch the NCache Management Center by going to http://localhost:8251 in your browser. Once the portal loads navigate to the “Clustered Caches” section from the left-hand navigation bar, if necessary. To create a new cache on the same clustered caches page, click on the “New” button, which initiates the creation process and displays a series of configuration options.
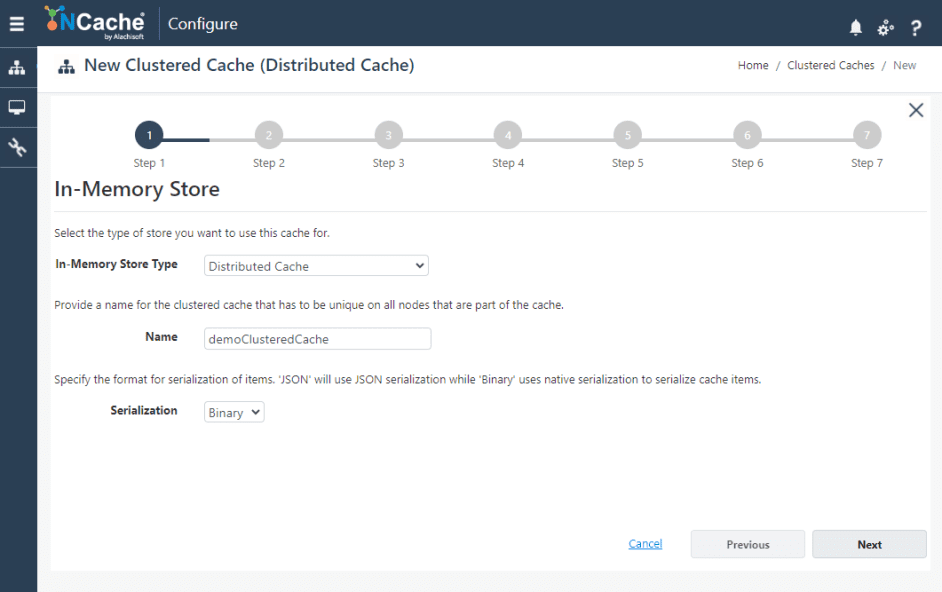
Figure 1: Configuring In-Memory Store and Serialization settings.
You will need to select an appropriate In-Memory Store Type from the dropdown menu, with options like:
Basic Settings
Once you’ve selected the cache type, give it a name and choose your preferred serialization format (either JSON or Binary), based on your application’s needs. For more information on the appropriate format for your use case, please refer to the NCache Documentation. Next, you’ll need to select the appropriate caching topology to specify how your cache will handle data replication and partitioning. You can also set operation timeouts and statistic replication intervals for optimized performance.
Adding Server Nodes
Next, specify the maximum cache size and add server nodes to the cluster by entering their IP addresses and clicking on the “add” button on the toolbar. Adding more nodes can enhance your cache’s capacity and availability.
Advanced Settings
After which, you can also configure advanced settings, like encryption and compression, for added security and efficiency. If necessary, you can configure eviction policies and port settings here as well. You can also ensure that the cache starts automatically by selecting “Start this cache on Finish”.
Once everything is configured, simply click on “Finish”, and your new cache cluster will be created. It will automatically appear in the list of clustered caches along with the configured server nodes and their status (i.e., whether they are running or not).
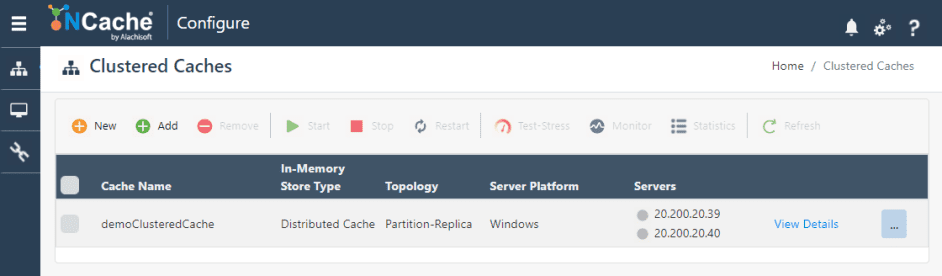
Figure 2: Viewing the created clustered cache and server node status.
However, if after creating your cache, you want to add more nodes to your cluster, you can easily do so at any time, as detailed in the NCache Documentation.
Start Cache
Once you’ve created your clustered cache, the next step is to ensure it’s up and running. If auto-start hasn’t been enabled, NCache allows you to start a cache across all server nodes at once or on a specific node individually.
Starting a Cache on All Server Node
To select the cache you want to start, simply check the box next to its name. You can start the cache using one of two methods:
- Method 1: Click on the “Start” button on the toolbar.
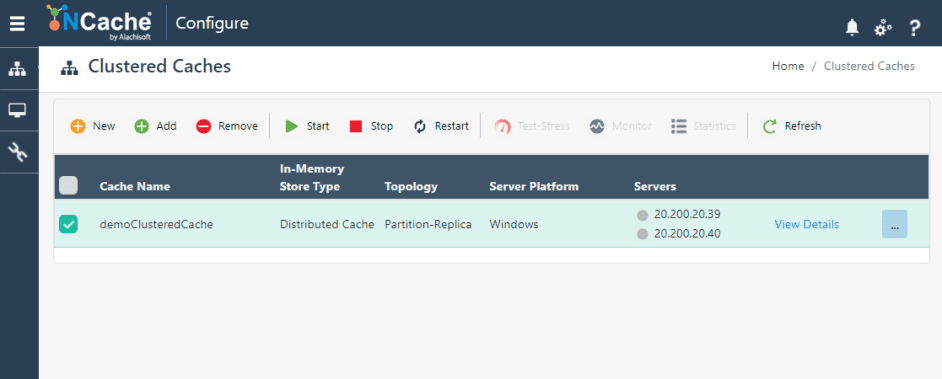
Figure 3: Starting the clustered cache via the management toolbar.
- Method 2: Click on the “…” button next to the cache name, resulting in a dropdown menu where you can select “Start.”
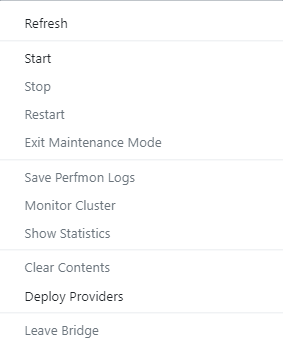
Figure 4: Accessing cache management operations via the dropdown menu.
When the cache starts, the server icons will change from grey to blue, and you’ll receive a success notification confirming that the cache is running.
Starting a Cache on a Specific Server Node
If you need to start a cache on a particular node, click on “View Details” next to the cache. This will open up a detailed configuration page.
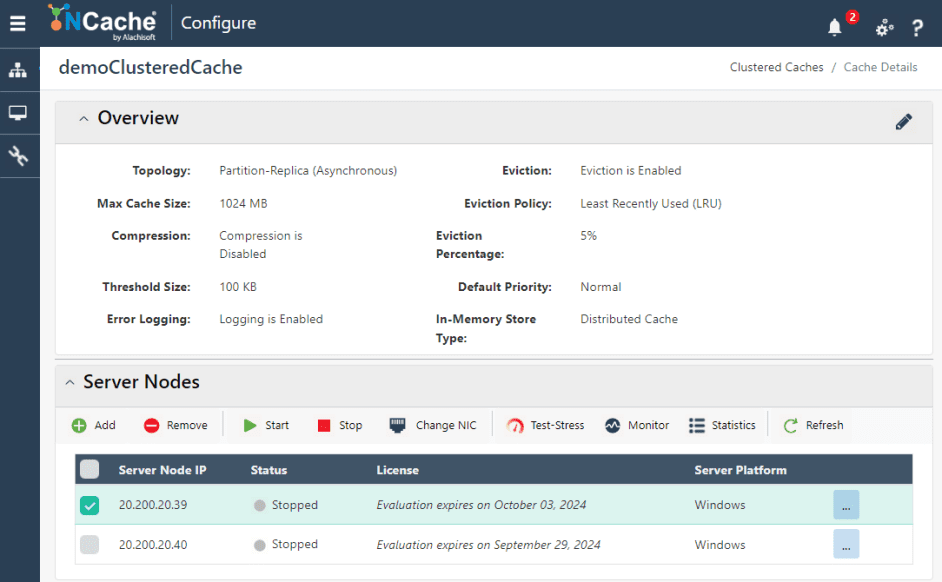
Figure 5: Selecting a specific server node to start within the cache details.
Under the “Server Nodes” tab, check the box next to the specific server node IP. You can start the cache on that node by either clicking on the “Start” button on the toolbar or by clicking on the “…” button for the dropdown menu and then selecting “Start”. Once the cache starts, the status of the server will change from “Stopped” to “Running”, and you will be notified accordingly.
Stop Cache
To stop a cache, you’ll follow nearly the same procedure as starting it, but instead of the “Start” button on the toolbar, you will click the “Stop” button. And as the cache stops, the server status will change from “Running” to “Stopped”, and a success notification will appear, indicating the process is complete.
Restart Cache
To restart an already running cache, use the “Restart” button. And as the cache restarts, the server status will change from “Running” to “Stopped” and back to “Running”.
Testing and Stress Monitoring
NCache provides a way to simulate heavy transactional loads on a cache to monitor its performance under stress, allowing you to evaluate how well the cache handles the maximum amount of stress. This process is called Test-Stress and is an essential part of understanding your cache’s behaviour in demanding scenarios.
To initiate a stress test, select the cache you want to test, then click on the “Test-Stress” button on the toolbar. After clicking on the “Test-Stress” button, you will be prompted to specify the duration of the stress test. Choose the desired time, then click on “Start” to begin the test.
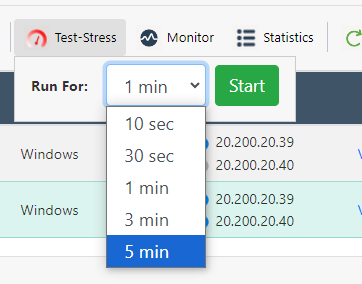
Figure 6: Configuring Test-Stress duration to monitor cache performance.
Monitoring Cache Performance
NCache also allows you to monitor cache performance using a series of graphical monitoring dashboards. These dashboards offer real-time performance insights, including various performance counters specific to different store types. You can also create custom dashboards to track specific metrics according to your needs.
By clicking on the “Monitor” button from the toolbar against your selected cache on the “Clustered Caches” page, you can visualize cache performance through graphical charts, helping you keep track of important metrics like memory usage, request rates, and cluster connectivity. The built-in dashboards are highly customizable, allowing you to modify the duration of monitoring, event logging, and API logging for more complete cache performance insights.
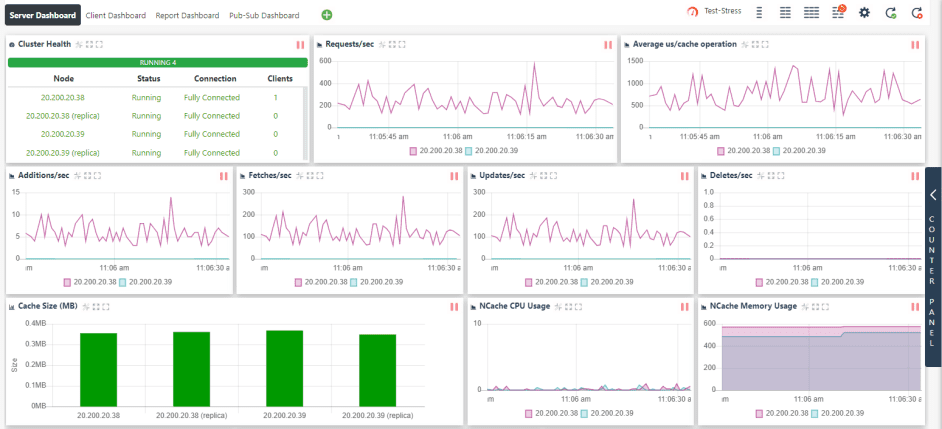
Figure 7: Monitoring cache performance using graphical dashboards.
Viewing Statistics
Statistics in NCache provide valuable insights into cache performance by displaying various performance counters relevant to your cache setup. To view the statistics for a specific cache, check the box next to its name. You have two methods to access the statistics. Either by clicking on the “Statistics” button on the toolbar or the “…” button next to the cache name and select “Show Statistics”. This will open a statistics window displaying various performance metrics for the selected cache.
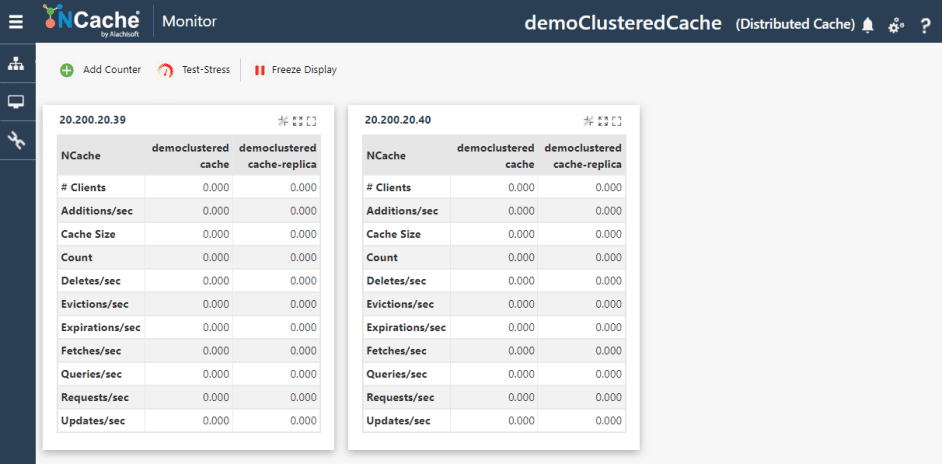
Figure 8: Viewing detailed cache statistics and performance counters.
Adding Perfmon Counters
To enhance your monitoring experience, you can add performance counters. Click on the “Add Counter” button on the statistics page which will open the dialog box shown below. From the category list, select NCache, which will show all the available server node caches. Choose the specific cache instance you wish to monitor, and a list of counters will appear.
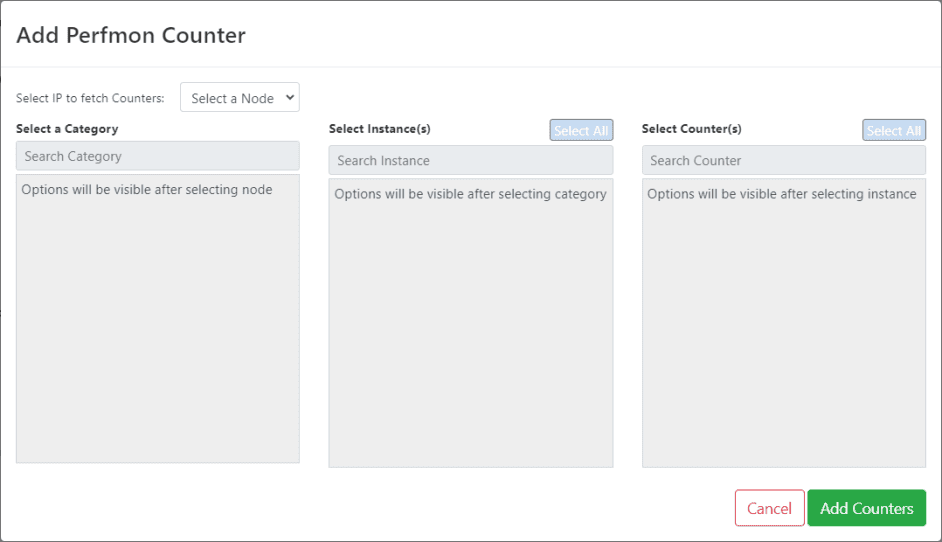
Figure 9: Adding custom Perfmon counters for granular cache monitoring.
Select the counters you require and click on “Add Counters” to incorporate them into the statistics window for monitoring. Additionally, the “Refresh” button in the toolbar allows you to refresh the cache, ensuring you always have the most current data available for proactive management.
Conclusion
In conclusion, managing cache clusters is now easier and more efficient with NCache, allowing you to optimize performance and scalability without the hassle. Try NCache today and unlock the full potential of your applications!
Frequently Asked Questions (FAQ)
Q: How do I verify if the NCache Service is running?
A: On Windows, open the Task Manager and navigate to the Services tab to look for NCacheSvc. You can also check or restart the service via the command line using the Start-Service -Name NCacheSvc command.
Q: Can I add server nodes to a cluster after it has already been created?
A: Yes. While you specify initial nodes during the “New Cache” wizard, you can easily add more server nodes to your cluster at any time via the NCache Management Center to enhance capacity and availability.
Q: What is the difference between starting a cache globally versus on a specific node?
A: NCache allows you to start a cache across all server nodes at once for a full cluster launch. Alternatively, you can use the “View Details” page to start the cache on a particular node individually, which is useful for targeted troubleshooting or maintenance.
Q: What does the “Test-Stress” tool specifically measure?
A: The Test-Stress feature allows you to simulate heavy transactional loads for a specified duration. This helps you evaluate how well your cache handles maximum stress and understand its behavior in demanding, high-traffic scenarios.
Q: How can I customize the monitoring experience in NCache?
A: Beyond the built-in graphical dashboards, you can add specific PerfMon counters to your statistics window. This allows you to track custom metrics like specific request rates or memory usage relevant to your unique setup.