NCache Management and Monitoring
NCache provides powerful management and monitoring tools that let you configure and monitor cache clusters and cache clients. These include web-based tools, command line tools, and integrations with third-party monitoring tools. NCache also offers logs and event viewers for deep observability and monitoring runtime statistics to minimize Mean Time to Resolution (MTTR) across different components.
NCache Management Center
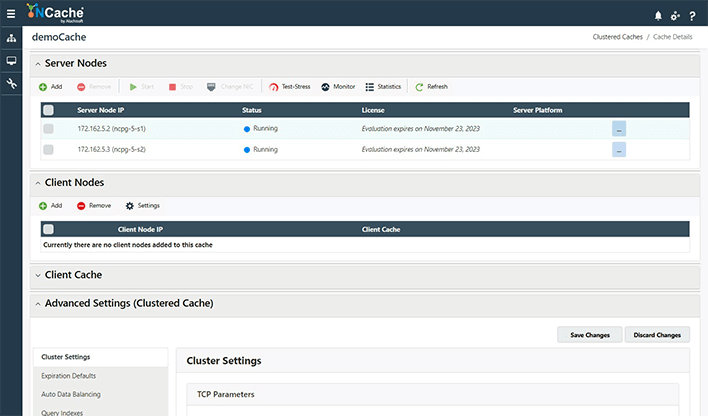
The NCache Management Center is web-based and lets you perform all cache management and configuration tasks smoothly from a browser. It offers users very easy-to-understand GUI for both Windows and Linux environments. You can access the NCache Management locally as well as remotely. The operations performed using the Management Center include:
- Cache/Cluster/Bridge creation
- Addition/Removal of clients or servers
- Deployment of server-side providers
- General cache cluster configurations (cache size, isolation levels, etc.)
- Security configurations, including RBAC (Role-Based Access Control) and TLS encryption management, ensuring compliance with enterprise data protection standards.
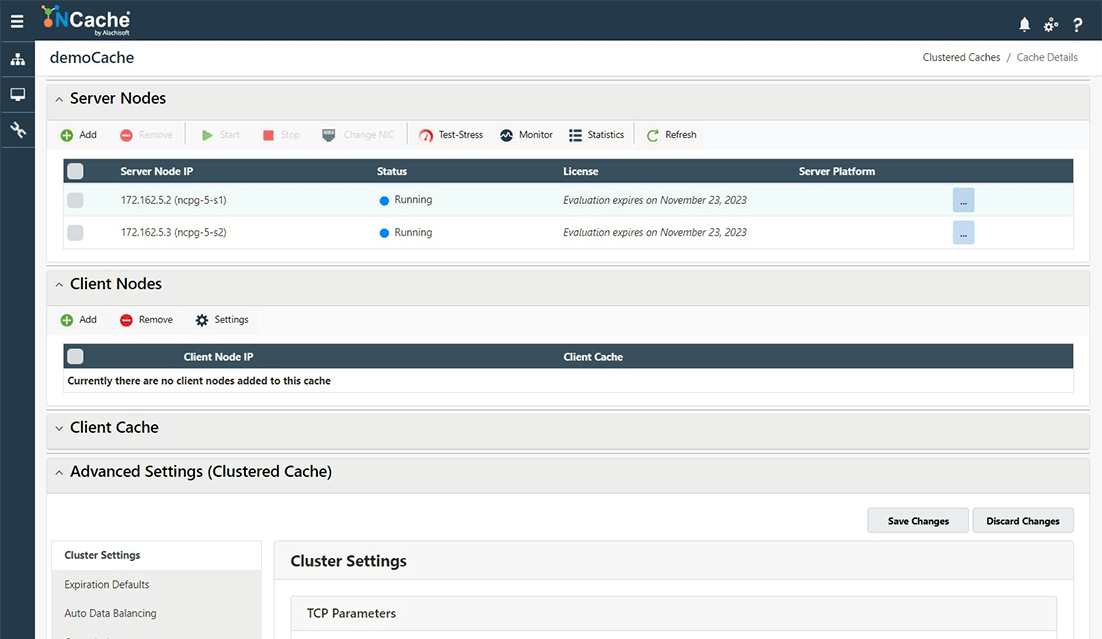
Management Center
NCache Monitor
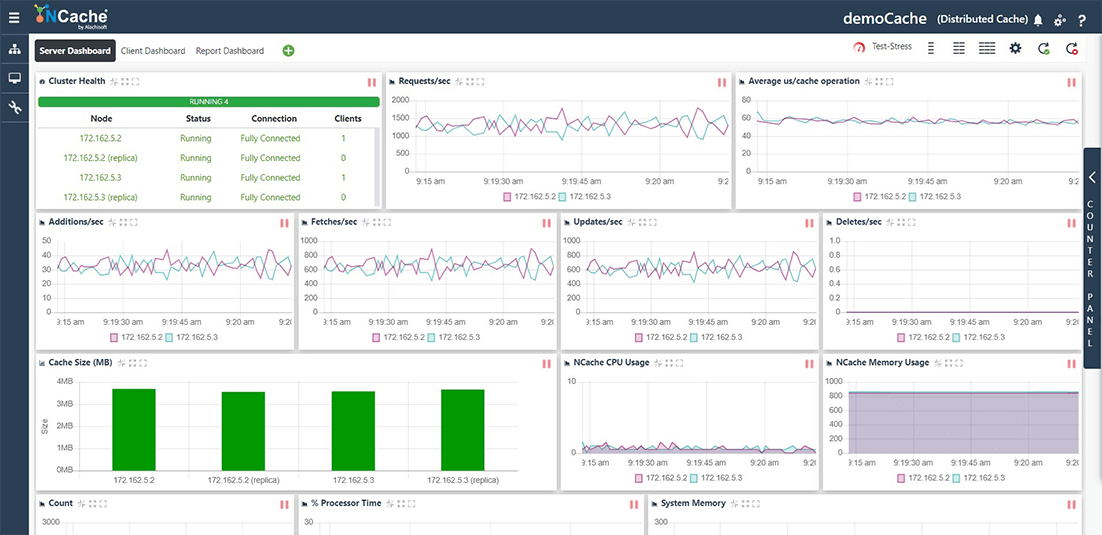
The NCache Monitor is a web-based monitoring tool to monitor the cache's health and activities. It shows a report and graphical view for monitoring your client and server statistics. You can launch the NCache Monitor through the NCache Management Center for Windows and Linux, and it also monitors everything remotely. The core features of the NCache Monitor are:
- Server dashboard to monitor counters for servers in the cache cluster.
- Client dashboard to monitor counters for remote cache clients (web/app servers).
- Custom dashboard to create and customize your dashboard.
- Counters to monitor statistics such as cache health, operations per second, cache size, CPU usage, etc.

NCache Monitor
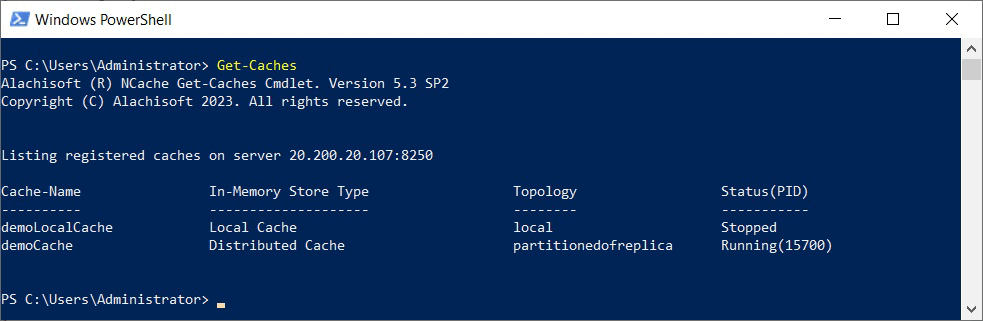
Command Line Tools
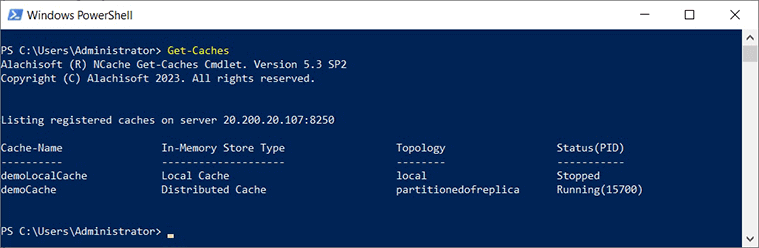
NCache provides all cache management operations through command-line tools as follows.
- Windows: PowerShell Cmdlets
- Linux: Command Line Tools
On Windows, NCache provides these tools as PowerShell cmdlets while on Linux, NCache provides regular command line tools. On both platforms, these command line tools are provided for automating cache and cluster management tasks, adhering to standard Microsoft automation paradigms and Linux CLI conventions for CI/CD integration. A few of the tools provided by NCache include:
PowerShell
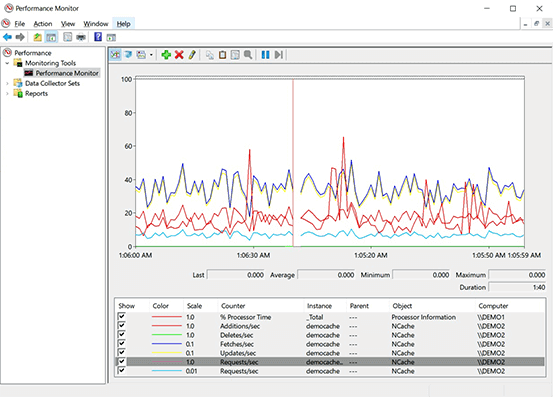
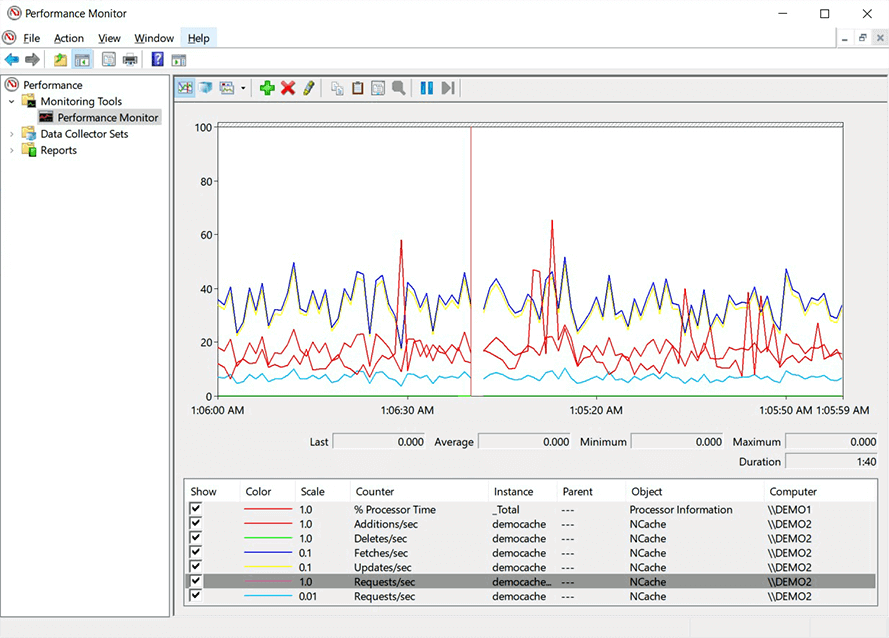
Windows Performance Monitor
The Windows Performance Monitor is a monitoring tool created by Microsoft for viewing real-time application statistics. NCache provides a rich set of performance monitoring counters, comparable to industry-standard APM (Application Performance Monitoring) metrics, for granular visibility into cache-tier latency. The following counters are provided by NCache:
- Cache Server Counters like State Transfer/sec and Updates/sec, etc.
- Cache Client Counters like fetches/sec and compression/sec, etc.
- Bridge Counters like bridge cache count and bridge cache size, etc.
Windows Performance Monitor
SNMP Monitoring
SNMP (Simple Network Management Protocol) is a standard protocol through which different devices on a network communicate and share information. NCache supports monitoring this protocol's activity using its SNMP counters. You can read more about these SNMP Counters in the NCache Administrators Guide.
NCache provides a rich set of performance monitoring counters for SNMP, which you can select to view in any third-party monitoring tool that supports SNMP. The following counters are provided by NCache:
- Cache Server Counters like State Transfer/sec and Updates/sec, etc.
- Cache Client Counters like fetches/sec and compression/sec, etc.
- Bridge Counters like bridge cache count and bridge cache size, etc.
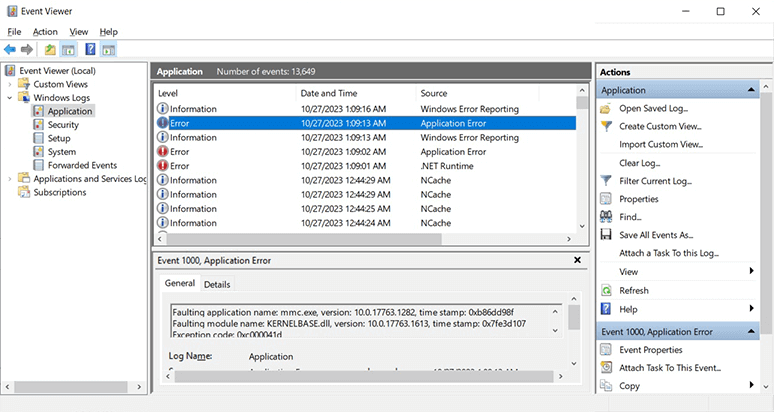
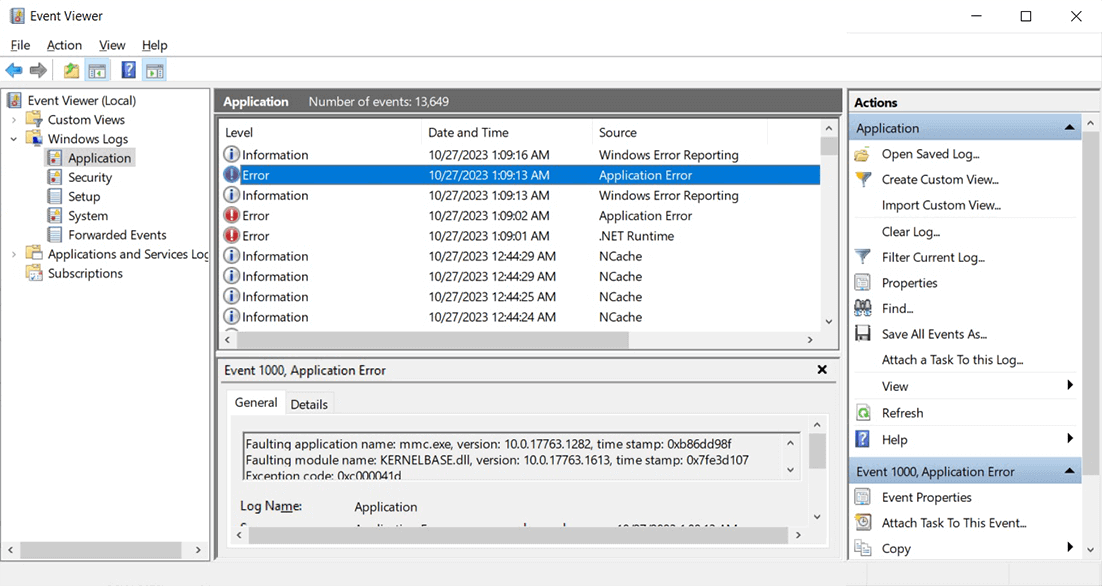
Windows Event Viewer
The Windows Event Viewer is a tool that shows a log of system messages - including errors, information messages, and warnings. NCache logs significant events in the Windows Event Viewer. It allows you to monitor the important events such as:
- NCache installation events.
- Errors encountered by NCache or Bridge services.
- Service/Cache start and stop.
- Cache server joining or leaving a cache cluster.
- Cache size going above a configurable 80% threshold.
Windows Event Viewer
Linux Event Log (/var/log)
Linux has a special directory for storing logs called /var/log, consistent with the Filesystem Hierarchy Standard (FHS). This directory contains logs from the OS itself, services, and various applications running on the system. NCache logs its events in /var/log style folder that you can then read. These include errors, information messages, and warnings.
NCache logs significant events in the /var/log file. This allows you to monitor the important events such as:
- NCache installation events.
- Errors encountered by NCache or Bridge services.
- Service/Cache start and stop.
- Cache server joining or leaving a cache cluster.
- Cache size going above a configurable 80% threshold.
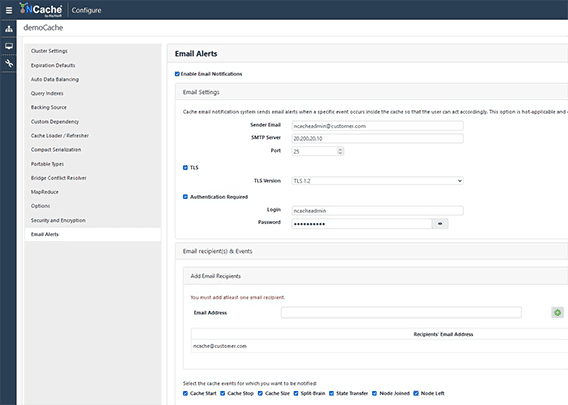
Email Notifications on NCache Events
Along with other third-party monitoring tools, NCache can notify users about relevant events through email alerts. These email notifications concern significant events such as:
- Cache start or stop.
- Cache server joining or leaving the cache cluster.
- Cache state transfer start or completion.
- Cache size going above a configurable 80% threshold.
Email Notifications on NCache Events
NCache Log Viewer
The NCache Log Viewer is an interactive GUI tool designed for accelerated root cause analysis. It displays logs in an organized manner, allowing administrators to filter by log levels (Error, Debug, Info) to quickly isolate cluster issues. This log viewer lets you maintain logs categorically, i.e., it allows separate field identification and customizes the search entries in a manner convenient for you. These logs show necessary information such as:
- Cache node where the operation takes place.
- Timestamp of the log.
- The process name and the name of the component.
- Thread name and log levels.
- A message with detailed log information about the success/failure of operations.
Management and Monitoring API & Events
NCache provides a set of methods to perform simple management and monitoring operations on the cache. It saves you from having to using the NCache Management Center or NCache PowerShell tools separately by managing them using the API. This enables programmatic observability, allowing for automated health checks within your application logic.
Management API & Events
NCache provides the following API calls for the management of NCache.
- StartCache API: It lets you start the cache by providing the server cache name and node. It also allows you to enable security on the cache.
- StopCache API: It lets you stop the cache by providing the server cache name and node. It also allows stopping a cache with security enabled.
Monitoring API
Similar to management, NCache provides a monitoring API for monitoring the cache. The list of monitoring APIs include:
- GetCacheHealth API: This method lets you view the connectivity status of cache server nodes by providing the cache name, server address, and port.
- ClientInfo API: It contains the client information of each client, such as ClientID, processID, AppName, etc.
- ConnectedClientList API: It gets you the list of all the clients connected to the cache.
Management Level Events
Management-level event notifications are events registered for management operations on the cache from your .NET or Java application. Notifications are triggered on the following management operations:
- Cache Clear: Whenever a cache is cleared.
- Cache Stop: Whenever a cache is stopped.
- Member Join: Whenever a node joins the cache cluster.
- Member Leave: Whenever a node leaves the cache cluster.
| Capability | Supported Tools | Business Impact |
|---|---|---|
| Cluster Orchestration | Management Center, PowerShell Cmdlets | Simplified cluster provisioning and remote configuration management. |
| Real-time Telemetry | NCache Monitor, SNMP, PerfMon | Enhanced visibility into cache health and proactive bottleneck detection. |
| DevOps Automation | Management API, Linux CLI | Seamless integration into CI/CD pipelines and automated scaling workflows. |
| Enterprise Observability | Log Viewer, Event Viewer, /var/log | Detailed audit trails and historical data for rapid troubleshooting. |
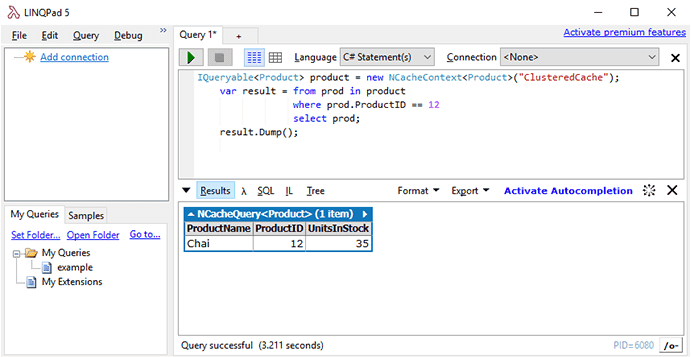
LINQPad Integration
LINQPad is a database querying software that employs LINQ, SQL, and other query languages without IDEs. NCache provides smooth integration with LINQPad, only requiring the addition of a reference to the NCache LINQPad provider and the custom objects you have stored in NCache. It lets you write your LINQ queries over the configured cache with LINQPad.
LINQPad Integration
