Imagine you have an e-commerce business that uses a distributed cache such as NCache for faster response times. During the holiday season, your cache cluster expects to serve thousands of connected clients. However, instead, your Customer Support team is bombarded with complaints about website downtime and slow user experience. What went wrong? Well, it’s simple. You failed to monitor the cache under peak loads.
You might ask, why does that matter? Monitoring your cache during production helps you identify warning signs before they become troublesome. Taking the time to do so prevents your business from experiencing potential network interruption, memory overheads, and more.
Rich Set of Monitoring Tools in NCache
Luckily for you, NCache comes with numerous tools to help you monitor your caches. These include all of the following.
NCache Web Manager
The Web Manager is a web-based management tool to configure your caches and view their statistics. This tool is shipped with your NCache installation and allows you to manage your caches by adding or removing nodes, configuring security, and more.
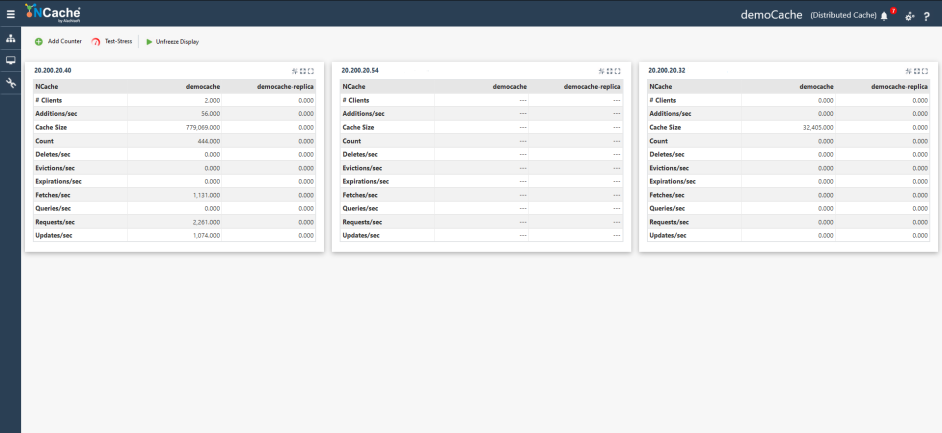
Figure 1: NCache Web Manager Cluster Statistics
NCache Web Monitor
The Web Monitor is a web-based monitoring tool that gives you a real-time assessment of how your distributed caches and remote clients perform. It contains an existing dashboard that provides simple drag-and-drop counters to monitor per node. You can also design custom dashboards according to your metrics of interest.
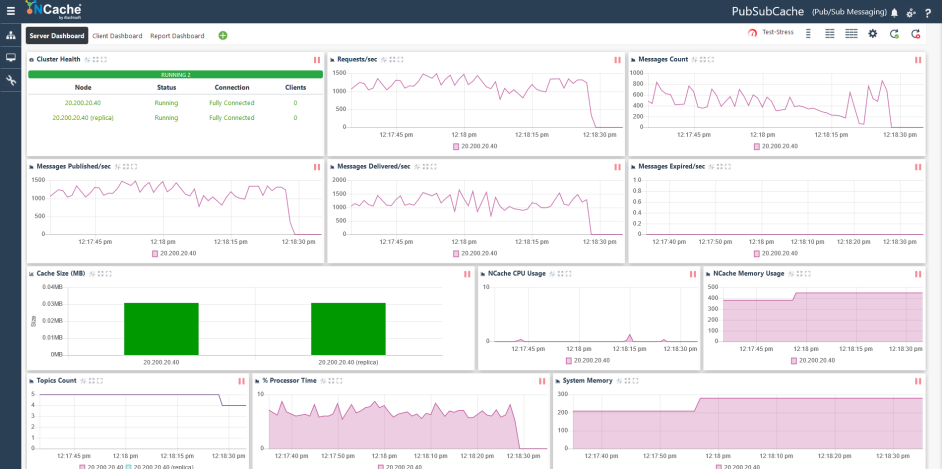
Figure 2: NCache Web Monitor
NCache Windows PowerShell
This PowerShell is a CLI tool that lets you monitor server and client statistics using Windows PowerShell. It provides you with a list of counters in .CSV format.
NCache Logs
These logs log all cache activity and are essential for detecting problems before they get serious or even for observing cache behavior under specific environments. All your cache/bridge activity is logged in files on each server node by default. NCache also provides a sophisticated Log Viewer to organize your logs for better readability.
Windows PerfMon Tools
These tools are a similarly valuable resource. The Windows Performance Monitor can access various NCache Perfmon Counters. So, you can monitor cache performance using PerfMon-compatible tools as well. This counter information can help you determine process limitations and fine-tune the environment and applications if needed.
NCache Event Logs NCache
These logs log events according to their severity in the Windows Event Logs (which provides a detailed record of all security, application, and system applications). These logs make quick work of diagnosing any errors in the cache cluster.
Third-Party Tools
Grafana & Prometheus are another excellent way to monitor your cache clusters. As Prometheus collects cluster data through the collected NCache Metrics, and Grafana uses it as a data source to display data as human-readable graphs.
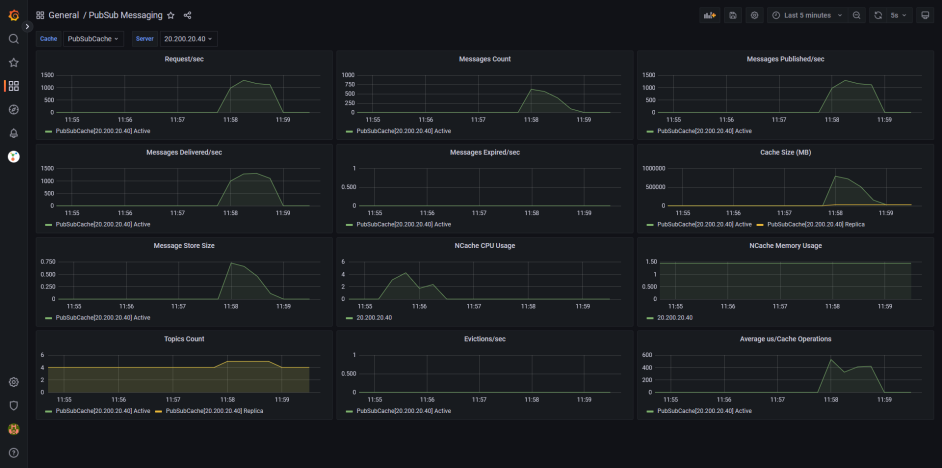
Figure 3: The Grafana Dashboard for the NCache Pub/Sub Messaging
Baseline Performance Test Before Production
Before you begin monitoring your caches in production, a pre-production baseline test is recommended – especially with your live environment configuration. The central aim of such a test is the acceptable performance threshold for your cache. This test can also take place during staging if you’ve finished production.
This baseline performance test enables you to monitor your cache performance against this threshold and helps diagnose a particular problem if you know the optimum performance. For example, you can choose to add more servers if the memory utilization is consistently higher than the baseline mark.
1. Application Performance Baseline
You only need to test your environment by considering the following:
Application Tier Testing – which is independent of NCache and is solely the performance of your application. For example, for a web app, you need to test the response time of the page requests.
Database Tier Testing (also NCache independent) involves checking the database response times for queries, network overhead, and performance for large database sets.
2. NCache Performance Baseline
So, where does NCache fit into this? For NCache, you should consider requests/sec, average time/operation, object size, and memory/CPU. Additionally, you can monitor the event logs to understand the events in a healthy, working state cluster to keep as a reference to compare when they go into production. You can even share these baseline details with the monitoring teams as a comparison.
Do keep in mind that NCache performance can impact your application’s performance, and anomalies are bound to occur. For instance, when the load increases, the CPU consumption on all the server nodes in the cluster increases. That is perfectly normal, as nothing is failing at this point. You only need to add another server to the cluster to share the load among all of them.
Monitor NCache Performance in Production
Monitoring NCache Cluster Health in Production
When dealing with a large number of clients in a distributed cache cluster, it goes without saying that you need to ensure that it is healthy and tuned under peak loads. The NCache server and client application health can be monitored through NCache tools that show you the healthy activity through cache counters.
Usually, data centers have great networks, but we have noticed within our customer environments that the sockets break or the network may be interrupted. This sort of scenario causes delays as the communication gets interrupted even if the whole connection does not break. Hence, it is necessary to monitor that the network does not become partially connected resulting in a split-brain and interrupted client connections.
NCache initiates an auto-recovery mechanism to resolve this, which is an expensive task. Hence, you need to monitor your cluster health.
Using NCache Web Monitor, you can monitor various metrics for cache health:
1- Cluster Health
You can see the status of each server node in a cluster, its connection with the other nodes, and the number of connected clients in one glance.
2- Windows Event Logs
You can easily check for any errors in the event log, which also displays a detailed message against each event. So, in case of a partially connected cluster, you can effortlessly diagnose whether it is because of split-brain or some other reason, as logged in the Event Logs window.
3- API Logs
You can also choose to log API calls from the server node to the client – however, this is a memory counter.
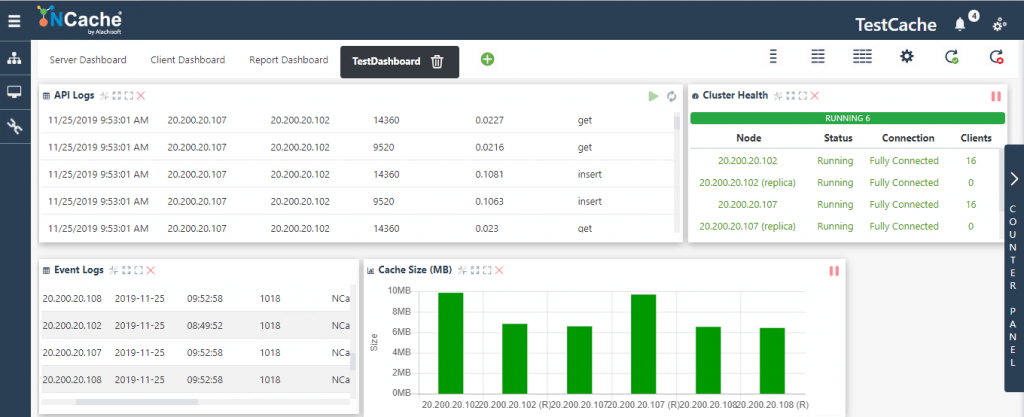
Figure 4: Cluster Health Monitoring for NCache
4. System Resources
To verify if your cluster is healthy, you also need to monitor your CPU utilization, memory spikes, and network usage – this vigilance ensures your applications don’t face a shortage. If you see a constant hike in CPU utilization, for example, you can choose to increase your CPU resources.
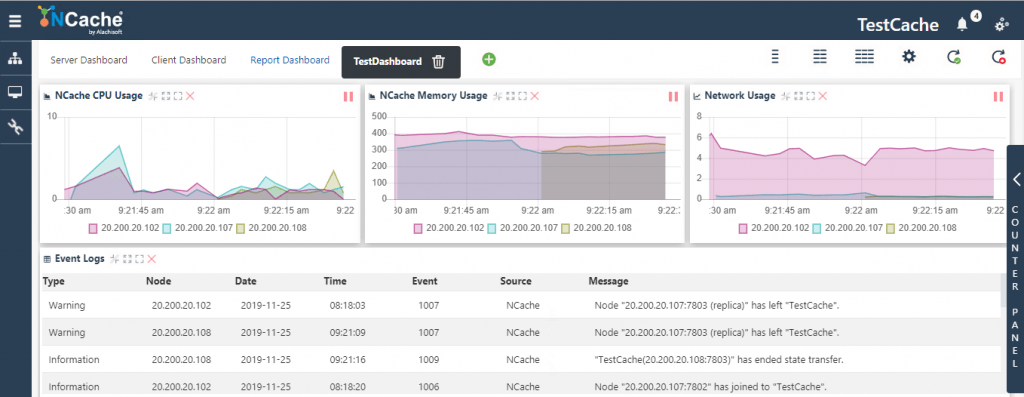
Figure 5: System Health Monitoring for NCache
5. NCache Alerts
NCache also provides a mechanism to send alerts on specific events like node start/stop or state transfer started. Such notifications are sent to a provided email, so you receive notifications of any unexpected activity anywhere. You can read more about this in the NCache Docs. Apart from these, cache health alerts for CPU utilization, queue size, memory, network bandwidth, and requests/sec are also logged in alerts.xml if the values cross the pre-configured threshold value.
Monitoring NCache Load/Capacity in Production
For such monitoring, you need to determine the general peak load for your cache cluster and transactions performed on each server. If influx increases, let’s say during an annual sale, there is a chance of environmental instability or uncertain behavior. For this, you need to monitor how many fetches or requests per second are being made on each server to quickly perform root cause analysis of any performance-related issue you might be encountering.
The throughput against the load will determine if there is a need for increasing the capacity. If you have already performed a baseline test for load monitoring, and the statistics show a consistent spike in the number of transactions, you can choose to scale up. You can do so by increasing the CPU resources or scaling out by adding more cache servers. We have already covered the counters you can employ.
Conclusion
NCache is a feature-rich distributed data store with 100% native .NET and Java support. Hence, when your cache clusters are running in a high transaction production environment, you must monitor the nodes, cluster, and client connections. Along with this, you need to keep an eye on the cache resources like memory and network bandwidth. NCache comes packed with multiple tools and alerts to make monitoring your cluster environment as convenient as possible.
This not only allows you to account for any unexpected spikes in the metrics, but it also helps you to easily diagnose performance degradation sources.