Browse Cache Statistics to Monitor Cache Performance
NCache provides real-time cache monitoring through comprehensive performance counters available in the NCache Management Center. By configuring these counters, you can track critical metrics such as request throughput, cache size, and latency across distributed, local, and clustered cache stores to ensure optimal application performance and health.
Note
This section provides the steps to monitor counters for a Distributed Cache. You can browse and monitor NCache Counters for caches with different store types by following the same steps.
Prerequisites
Make sure the NCache Service is started. If it is not started, do the following:
To start the NCache Service on Windows, open Windows PowerShell as Administrator and run the following command:
Start-Service -Name NCacheSvc
Make sure that you run the NCache Service as an administrator. Here are the steps to do so:
- Open the Services window and look for NCache in the list.
- Right click on NCacheSvc from the list and choose Properties.
- Go to the Log On tab and click on the Browse button.
- In the object name field, type Administrator and click on the Check Names button.
- It will pick the appropriate Administrator, then click OK.
- Now, set a Password and click OK.
- Right click on the NCache Service and choose the Restart option. Now your service will start running as administrator.
Using the NCache Management Center
Launch the NCache Management Center by browsing to http://localhost:8251 or
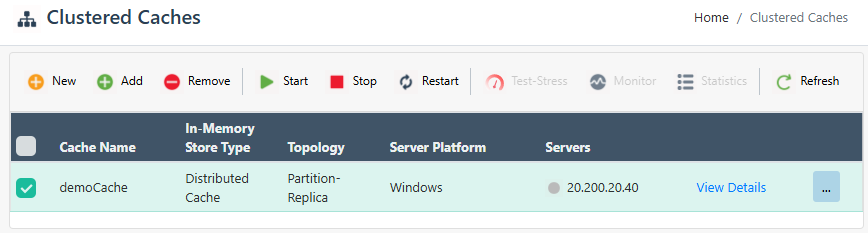
<server-ip>:8251.In the left navigation bar, click on Local Caches or Clustered Caches based on your requirements. This opens up a new page. It shows any existing Local or Clustered caches and additional details like the Server and Server Platform.
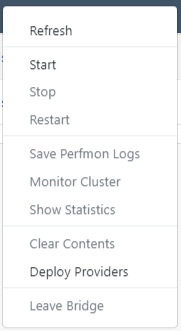
- Select the cache. For this you may click on the "..." button against the cache name and click on Show statistics from the available options. Or you may click on the
 from the toolbar for which you will have to select the checkbox against the cache name.
- A Statistics window will open showing the cache statistics.
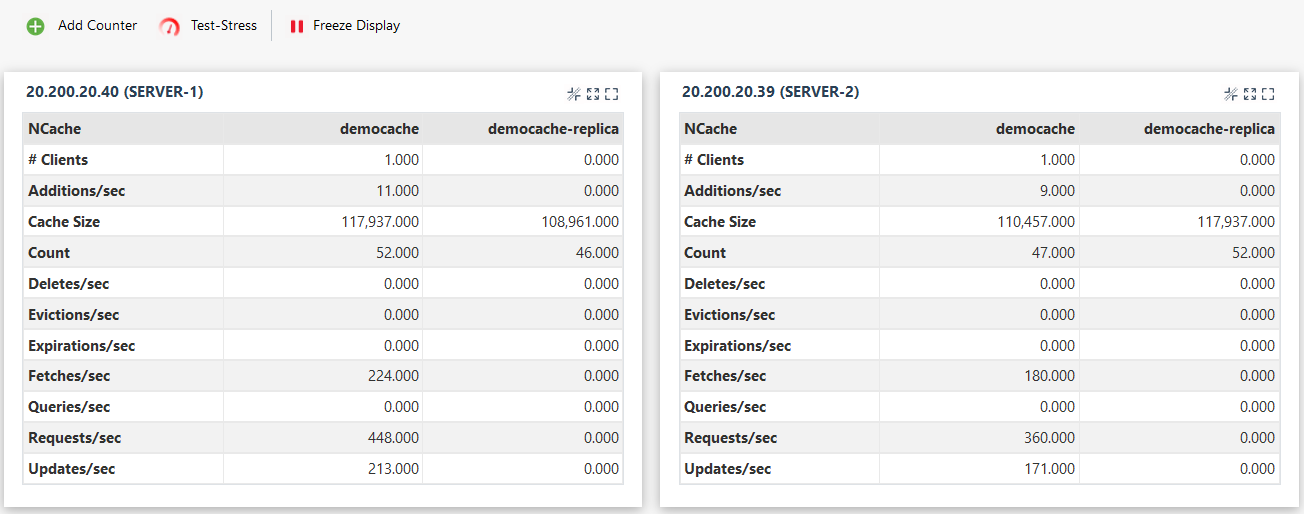
- In order to add counters for monitoring, click on Add Counter.
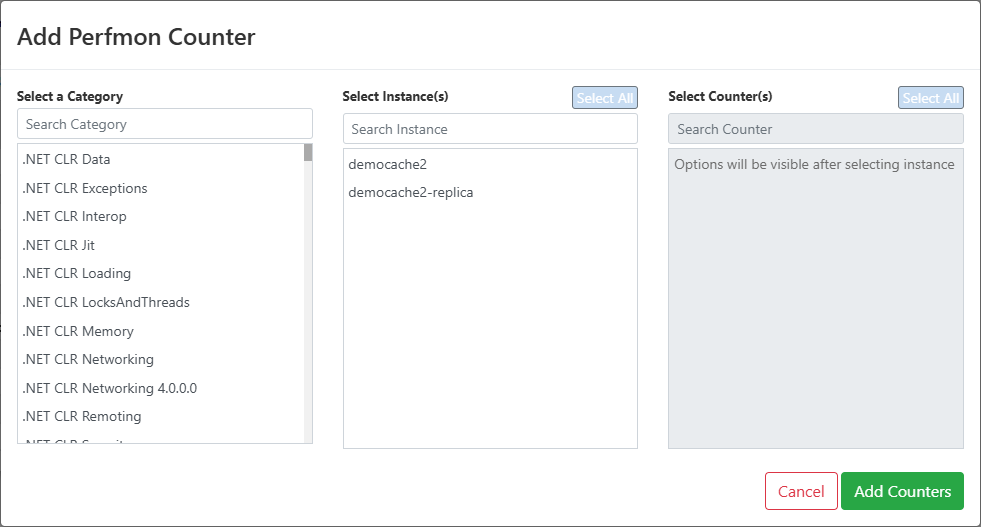
- From the category list, select NCache - it shows all the present caches on the server node provided.

Select the instance of the cache that needs to be monitored. A list of counters is displayed.
Select the counters from the list and click on Add Counters.

See Also
Monitor Cluster Connectivity
Monitor Cache Clusters using NCache Email Alerts
Monitor Cache Using Test Stress